Introduction
With their modest cost, compact size and great flexibility, UV-VIS-NIR miniature fiber optic spectrometers are attractive analytical tools for photovoltaic materials research and quality control. Typical applications include analysis of the optical properties of solar cell materials, spectroradiometric measurement of solar simulators used in panel testing and quality control in panel production.
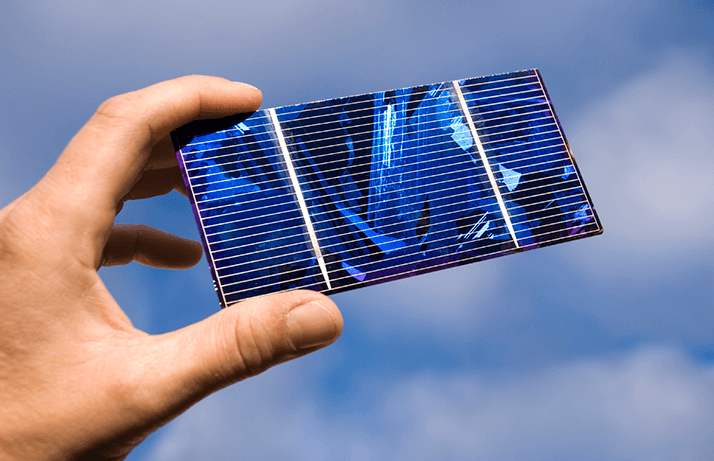
We evaluated NIR spectroscopy as a method to measure the reflection of photovoltaic panel materials. A manufacturer of thin film photovoltaic panels requested NIR reflectivity analysis of several coated glass samples. Measurements were conducted from 1200-2100 nm under ambient lab lighting conditions. Because the absorbance of photovoltaic panels is so critical, determining the reflectivity at panel edges and elsewhere is a good indicator of the light loss at those areas. The use of anti-reflective coatings and glass dopants are among the approaches manufacturers may evaluate in improving panel efficiency.
Experimental Conditions
Five coated glass samples were analyzed with an Ocean Optics NIRQuest256-2.1 spectrometer configured with a 100 um slit and optimized for the range from 1200-2100 nm. The sampling setup comprised a tungsten halogen light source, 400 μm reflection probe and an optical stage. A specular reflection standard was used as a reference. Spectrometer operating software completed the setup. The glass samples were placed on the sample holder uncoated side down, to ensure that the probe measured the reflection from the coating through the glass. The optical stage helped to position the probe at 90° to measure specular reflectance. Measurements were taken under overhead lighting conditions. The high-powered tungsten halogen light source provided continuous illumination from 360-2000 nm. The distance from the tip of the reflection probe to the surface of the sample was measured at ~7.0 cm for each sample, to simulate production conditions. Ocean Optics NIR spectrometers use a high-performance InGaAs-array detector in a compact optical bench with thermoelectric cooler and low-noise electronics. The NIRQuest256-2.1 is suited to applications involving higher wavelengths (peak responsivity is ~1900 nm). The spectrometer's rapid integration times -- spectral acquisition of 1 millisecond is possible -- make it viable for high production environments.
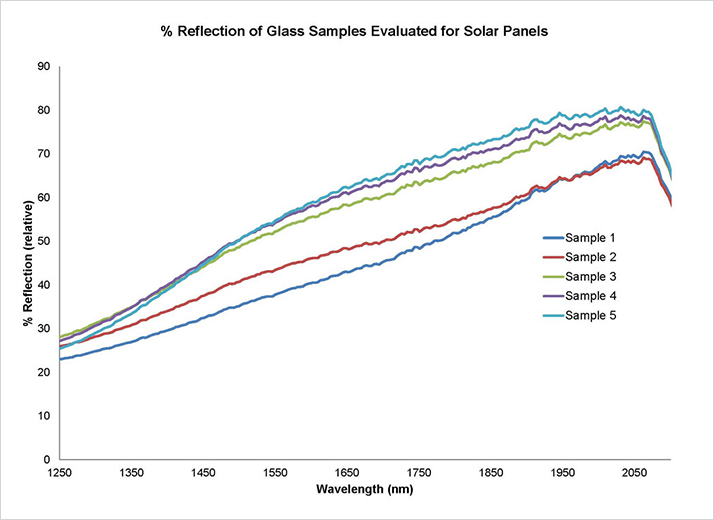 Figure 1: NIR specular reflection measurements reveal differences in coated glass samples being evaluated for use in photovoltaic panels.
Results
The measurements showed good stability with no averaging and boxcar smoothing. The reflection spectra for the samples (Figure 1) demonstrated that reflection values increased as a function of wavelength comparably across all five samples, peaking at about 2000 nm. Also, the gap between the least reflective and most reflective samples was relatively narrow at the lower and upper ranges of the wavelength range, with the greatest variation observed near 1700 nm.
>> Download the full Application Note as PDF
Newsletters
Receive the latest pathologist news, personalities, education, and career development – weekly to your inbox.