Conexiant
Login
  • The Analytical Scientist
  • The Cannabis Scientist
  • The Medicine Maker
  • The Ophthalmologist
  • The Pathologist
  • The Traditional Scientist
The Analytical Scientist
  • Explore

    Explore

    • Latest
    • News & Research
    • Trends & Challenges
    • Keynote Interviews
    • Opinion & Personal Narratives
    • Product Profiles
    • App Notes

    Featured Topics

    • Mass Spectrometry
    • Chromatography
    • Spectroscopy

    Issues

    • Latest Issue
    • Archive
  • Topics

    Techniques & Tools

    • Mass Spectrometry
    • Chromatography
    • Spectroscopy
    • Microscopy
    • Sensors
    • Data and AI

    • View All Topics

    Applications & Fields

    • Clinical
    • Environmental
    • Food, Beverage & Agriculture
    • Pharma and Biopharma
    • Omics
    • Forensics
  • People & Profiles

    People & Profiles

    • Power List
    • Voices in the Community
    • Sitting Down With
    • Authors & Contributors
  • Business & Education

    Business & Education

    • Innovation
    • Business & Entrepreneurship
    • Career Pathways
  • Events
    • Live Events
    • Webinars
  • Multimedia
    • Video
Subscribe
Subscribe

False

The Analytical Scientist / App Notes / 2015 / Identification of polymers using handheld Raman spectroscopy

Identification of polymers using handheld Raman spectroscopy

08/05/2015

Share

Featured Image
Introduction

Today’s industry, but also daily life, cannot be imagined without polymers. Handheld Raman spectroscopy is uniquely suited for the identification of commonly used polymers, because evident results are obtained within seconds. Furthermore, because Raman analysis is nondestructive, later use or recycling of the sample remains unrestricted. In this study, a library of widespread polymers of different colors was built and subsequently used for the identification of unknown polymer samples.

Experimental

All spectra were measured using the Mira M-1 handheld Raman spectrometer in auto acquisition mode, i.e., integration times were determined automatically. A laser wavelength of 785 nm and the Orbital-Raster-Scan (ORS) technique were used. As many of the polymer samples were very thin, spectra were recorded with the point-and-shoot adapter which is suitable for a short working distance (SWD). An extensive collection of ABS (Acrylonitrile butadiene styrene), PA (Polyamide), PC (Polycarbonate), PE (Polyethylene), PP (Polypropylene), PS (Polystyrene), PET (Polyethylene terephthalate), PVC (Poly(vinyl chloride)), and PMMA (Poly(methyl methacrylate)) polymer standards and samples of different colors was used to build a comprehensive library with the Mira Cal software.

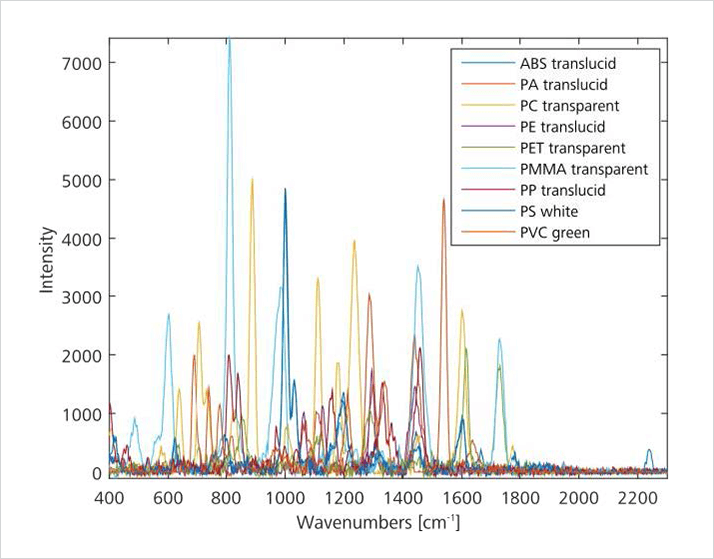
Figure 1: Overlay of the spectra of selected polymer samples (plot made with MATLAB)
Results and discussion

For each polymer kind, one spectrum (i.e., one color) was chosen, and these spectra were superimposed. The overlay (figure 1) shows that each of the polymers has a unique spectrum that differentiates it from the other analyzed plastics. The spectral area containing the majority of peaks reaches from 600 to 1800 cm-1; proving that the spectral range of Mira M-1 is appropriate for the studied polymer samples.

>> Download the full Application Note as PDF

Newsletters

Receive the latest analytical scientist news, personalities, education, and career development – weekly to your inbox.

Newsletter Signup Image

Explore More in Analytical Science

Dive deeper into the analytical science. Explore the latest articles, case studies, expert insights, and groundbreaking research.

False

Advertisement

Recommended

False

Related Content

NIR on the Range: Grazing Animal Nutrition

January 16, 2015

Portable NIR spectroscopy of grazing animal feces ...

Oceans Help Predict a Wave of Climate Change

January 16, 2015

A fluorescence-based assay helps study carbon fixa...

Why They Choose FDGSi

February 17, 2015

Find out why companies choose F-DGSi

Comparison of Biotage® Extrahera™ vs. Manual Sample Processing Using a Vacuum Manifold

February 27, 2015

Comparison of Biotage® Extrahera™ vs...

False

The Analytical Scientist
Subscribe

About

  • About Us
  • Work at Conexiant Europe
  • Terms and Conditions
  • Privacy Policy
  • Advertise With Us
  • Contact Us

Copyright © 2025 Texere Publishing Limited (trading as Conexiant), with registered number 08113419 whose registered office is at Booths No. 1, Booths Park, Chelford Road, Knutsford, England, WA16 8GS.