Conexiant
Login
  • The Analytical Scientist
  • The Cannabis Scientist
  • The Medicine Maker
  • The Ophthalmologist
  • The Pathologist
  • The Traditional Scientist
The Analytical Scientist
  • Explore

    Explore

    • Latest
    • News & Research
    • Trends & Challenges
    • Keynote Interviews
    • Opinion & Personal Narratives
    • Product Profiles
    • App Notes

    Featured Topics

    • Mass Spectrometry
    • Chromatography
    • Spectroscopy

    Issues

    • Latest Issue
    • Archive
  • Topics

    Techniques & Tools

    • Mass Spectrometry
    • Chromatography
    • Spectroscopy
    • Microscopy
    • Sensors
    • Data and AI

    • View All Topics

    Applications & Fields

    • Clinical
    • Environmental
    • Food, Beverage & Agriculture
    • Pharma and Biopharma
    • Omics
    • Forensics
  • People & Profiles

    People & Profiles

    • Power List
    • Voices in the Community
    • Sitting Down With
    • Authors & Contributors
  • Business & Education

    Business & Education

    • Innovation
    • Business & Entrepreneurship
    • Career Pathways
  • Events
    • Live Events
    • Webinars
  • Multimedia
    • Video
Subscribe
Subscribe

False

The Analytical Scientist / App Notes / 2015 / Quantitative Analysis of EtG and EtS in Urine Using FASt® ETG and LC-MS-MS

Quantitative Analysis of EtG and EtS in Urine Using FASt® ETG and LC-MS-MS

06/17/2015

Share

Featured Image
Introduction

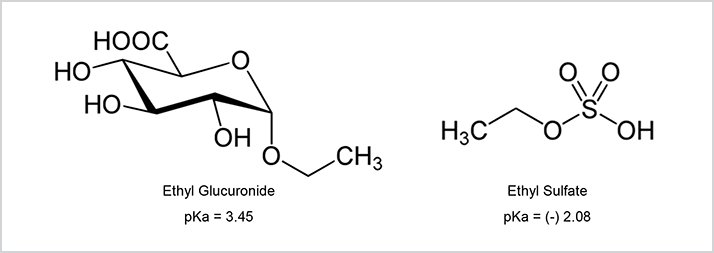
Ethyl glucuronide (EtG) and ethyl sulfate (EtS) are conjugated ethanol metabolites formed in low amounts in the body following alcohol consumption. Compared with ethanol, EtG and EtS are excreted in urine for a prolonged time. Published literature indicates that EtG may be detectable for up to 80 hours after alcohol ingestion, while EtS is generally detectable for up to 24 hours after use, making them both valuable as sensitive alcohol biomarkers. The detection of these metabolites has proven advantageous for zero tolerance treatment programs and abstinence enforcement where information regarding recent alcohol consumption is required. The cutoff level for EtG confirmation is typically 500 ng/mL or higher; the EtS confirmation cut-off level is generally set at 100 ng/mL.

When analyzing chemical residues in a complex biological matrix, such as urine, a sample pre-treatment step is generally required to eliminate non-desirable matrix components and/or concentrate the analyte(s) of interest. However, due to the highly polar nature of EtG and EtS (log P of 1.51 and 0.62, respectively), many labs turn away from traditional sample preparation procedures and instead use a dilute-and-shoot or simple filtration approach. These techniques do not adequately remove interferences from the sample and significant matrix suppression is commonly experienced during instrumental analysis. This is further complicated by the lack of retention of EtG/EtS on a traditional reversed phase HPLC column.

UCT has developed a line of products that allows for the efficient analysis of EtG and EtS in urine. By pairing UCT’s FASt® ETG SPE cartridge with a Selectra® ETG HPLC column, cleaner extracts and lower LOD’s/LOQ’s can be achieved when comparing to a dilute-and-shoot method.

Procedure
  1. Sample and diluents are added in an appropriately labeled tube. Add appropriate volume internal standard(s). It is recommended to use an internal standard volume of no more than 200 μL.
  2. Set up extraction manifold with FASt® ETG cartridges and auto-sampler collection vials.
  3. Pour sample into FASt® ETG cartridges and elute sample directly into auto-sampler vials.
  4. Cap vials and put directly onto LC/MS for analysis.

Download the full Application Note as PDF

Newsletters

Receive the latest analytical scientist news, personalities, education, and career development – weekly to your inbox.

Newsletter Signup Image

Explore More in Analytical Science

Dive deeper into the analytical science. Explore the latest articles, case studies, expert insights, and groundbreaking research.

False

Advertisement

Recommended

False

Related Content

NIR on the Range: Grazing Animal Nutrition

January 16, 2015

Portable NIR spectroscopy of grazing animal feces ...

Oceans Help Predict a Wave of Climate Change

January 16, 2015

A fluorescence-based assay helps study carbon fixa...

Why They Choose FDGSi

February 17, 2015

Find out why companies choose F-DGSi

Comparison of Biotage® Extrahera™ vs. Manual Sample Processing Using a Vacuum Manifold

February 27, 2015

Comparison of Biotage® Extrahera™ vs...

False

The Analytical Scientist
Subscribe

About

  • About Us
  • Work at Conexiant Europe
  • Terms and Conditions
  • Privacy Policy
  • Advertise With Us
  • Contact Us

Copyright © 2025 Texere Publishing Limited (trading as Conexiant), with registered number 08113419 whose registered office is at Booths No. 1, Booths Park, Chelford Road, Knutsford, England, WA16 8GS.