Conexiant
Login
  • The Analytical Scientist
  • The Cannabis Scientist
  • The Medicine Maker
  • The Ophthalmologist
  • The Pathologist
  • The Traditional Scientist
The Analytical Scientist
  • Explore

    Explore

    • Latest
    • News & Research
    • Trends & Challenges
    • Keynote Interviews
    • Opinion & Personal Narratives
    • Product Profiles
    • App Notes

    Featured Topics

    • Mass Spectrometry
    • Chromatography
    • Spectroscopy

    Issues

    • Latest Issue
    • Archive
  • Topics

    Techniques & Tools

    • Mass Spectrometry
    • Chromatography
    • Spectroscopy
    • Microscopy
    • Sensors
    • Data and AI

    • View All Topics

    Applications & Fields

    • Clinical
    • Environmental
    • Food, Beverage & Agriculture
    • Pharma and Biopharma
    • Omics
    • Forensics
  • People & Profiles

    People & Profiles

    • Power List
    • Voices in the Community
    • Sitting Down With
    • Authors & Contributors
  • Business & Education

    Business & Education

    • Innovation
    • Business & Entrepreneurship
    • Career Pathways
  • Events
    • Live Events
    • Webinars
  • Multimedia
    • Video
Subscribe
Subscribe

False

The Analytical Scientist / App Notes / 2015 / UHPLC Analysis of Immunoglobulins with TSKgel® UP-SW3000 SEC Columns

UHPLC Analysis of Immunoglobulins with TSKgel® UP-SW3000 SEC Columns

10/07/2015

Share

Featured Image
Introduction

Antibody therapeutics are enjoying high growth rates, the major areas of therapeutic application being cancer and immune/inflammation-related disorders including arthritis and multiple sclerosis. In 2013, six of the top ten best-selling global drug brands were monoclonal antibodies (mAbs) and more than 400 monoclonals were in clinical trials. The characterization of these complex biomolecules is a major challenge in process monitoring and quality control. The main product characteristics to be monitored are aggregate and fragment content, glycosylation pattern and charged isoforms.

The standard method used in biopharmaceutical QC for mAb aggregate and fragment analysis is size exclusion chromatography (SEC). A new series of 2 micron silica based UHPLC columns with 25 nm (250 Å) pore size can be applied to either increase speed or improve resolution of the separation of antibody fragments, monomers, and dimers.

Experimental

Columns:    TSKgel UP-SW3000 (P/N 0023449), 2 μm
                       Competitor Protein SEC Column, 1.7 μm
Column size:    4.6 mm ID x 15 cm
Eluent:    100 mmol/L phosphate buffer (pH 6.7) +
                 100 mmol/L sodium sulfate + 0.05% NaN3
Flow rate:    0.35 mL/min
Temperature:    25 °C
Detection:    UV @ 280 nm, micro flow cell
Sample (Calibration):
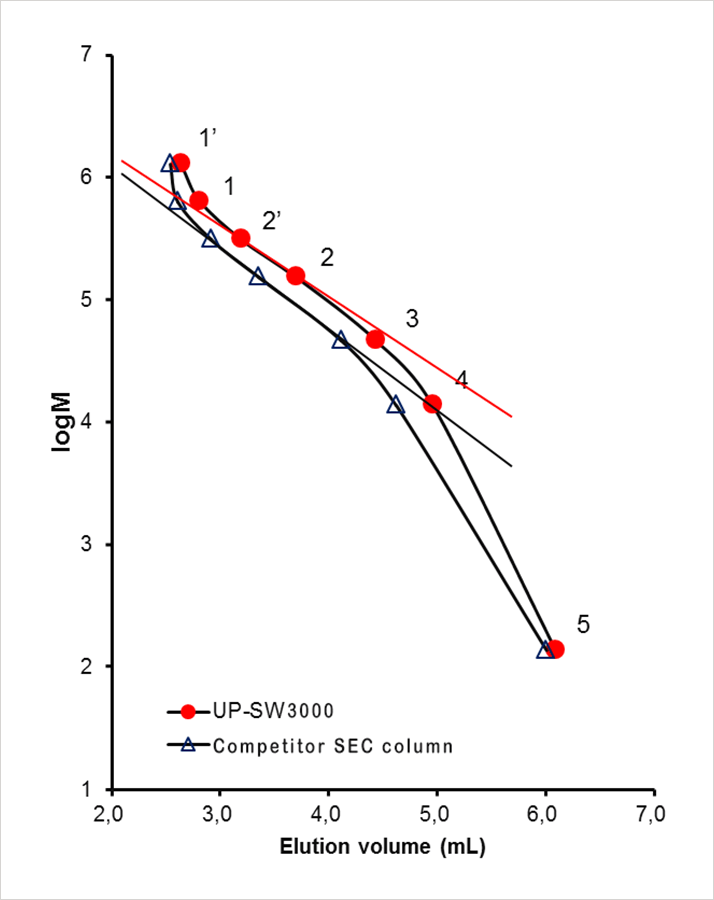
                 1. thyroglobulin, 640,000 Da
                 (1’ thyroglobulin dimer);
                 2. γ-globulin, 155,000 Da
                 (2’ γ-globulin dimer);
                 3. ovalbumin, 47,000 Da;
                 4. ribonuclease A, 13,700 Da;
                 5. p-aminobenzoic acid, 137 Da
Inj. Volume:    5 μL
Sample (mAb Analysis):
                 therapeutic mAb (mouse-human chimeric)
                 1: trimer; 2: dimer;
                 3: monomer ; 4: fragment
Inj. Volume:    10 μL

Results

Figure 1 shows the calibration curves of the new TSKgel UP-SW 3000 2 μm column and a commercially available 1.7 micron UHPLC column. The calibration of TSKgel UP-SW3000 shows a shallower slope in the region of the molecular weight of γ-globulin. These differences in the separation range and steepness of the curves are related to a slight difference in pore size (25 nm for TSKgel versus 20 nm for the 1.7 µm material).

Calibration curves
>> Download the full Application Note as PDF

Newsletters

Receive the latest pathologist news, personalities, education, and career development – weekly to your inbox.

Newsletter Signup Image

Explore More in Pathology

Dive deeper into the world of pathology. Explore the latest articles, case studies, expert insights, and groundbreaking research.

False

Advertisement

Recommended

False

Related Content

NIR on the Range: Grazing Animal Nutrition

January 16, 2015

Portable NIR spectroscopy of grazing animal feces ...

Oceans Help Predict a Wave of Climate Change

January 16, 2015

A fluorescence-based assay helps study carbon fixa...

Why They Choose FDGSi

February 17, 2015

Find out why companies choose F-DGSi

Comparison of Biotage® Extrahera™ vs. Manual Sample Processing Using a Vacuum Manifold

February 27, 2015

Comparison of Biotage® Extrahera™ vs...

False

The Analytical Scientist
Subscribe

About

  • About Us
  • Work at Conexiant Europe
  • Terms and Conditions
  • Privacy Policy
  • Advertise With Us
  • Contact Us

Copyright © 2025 Texere Publishing Limited (trading as Conexiant), with registered number 08113419 whose registered office is at Booths No. 1, Booths Park, Chelford Road, Knutsford, England, WA16 8GS.