To protect ecosystems from biodiversity loss, we need accurate and internationally comparable monitoring methods. Ideally, they should be cost effective and able to access the most remote of areas – but that’s exactly where current methods struggle.
Now, two researchers from the University of Zurich and the University of Montreal have developed a new method to monitor biodiversity from space; specifically, they showed that changes in plant species’ composition can be reliably assessed using imaging spectroscopy at the beta-diversity scale (1). In the press release (2), the authors said they are hoping “to provide evidence-based guidance for policy measures.”
According to the authors, the study is paving the way for planetary-level, close-to-real-time biodiversity monitoring. To explore this fascinating concept further, we spoke to Anna Schweiger, Postdoctoral Researcher at the University of Zurich, Switzerland, the lead author of the study.
What inspired your research?
Climate change is altering vegetation composition and the distribution of plant species at an unprecedented rate. Unfortunately, it is impossible to keep up with these changes globally with traditional field work alone. Thus, we need remote sensing to monitor the world’s biodiversity, which is why we turned to imaging spectrometry…
Explain how imaging spectrometers work…
Spectral reflectance profiles are continuous representations of the interaction between electromagnetic radiation and matter across a range of wavelengths. In the visible part of the spectrum (400–700 nm), light is predominantly absorbed by plant pigments to power photosynthesis. In the near-infrared (700–1,000 nm) and short-wave infrared (1,000–2,500 nm) regions, the absorption properties of cellular molecules (including water), as well as the internal and external structural characteristics of leaves, such as intercellular spaces, cell-wall thickness, waxiness of the cuticle and trichomes, influence how electromagnetic radiation is scattered and absorbed.
At the whole-plant level, architectural and morphological characteristics, such as branching structure, leaf size, leaf clumping, and leaf angle distribution also influence spectral reflectance. The spectral differences among plants thus capture functional differences in chemical, anatomical, and morphological traits. “Imaging spectrometers” capture reflectance pixel per pixel in spatially co-registered images. They can be operated from a variety of platforms, including unmanned aircraft systems, airplanes, and satellites.
What did the findings reveal?
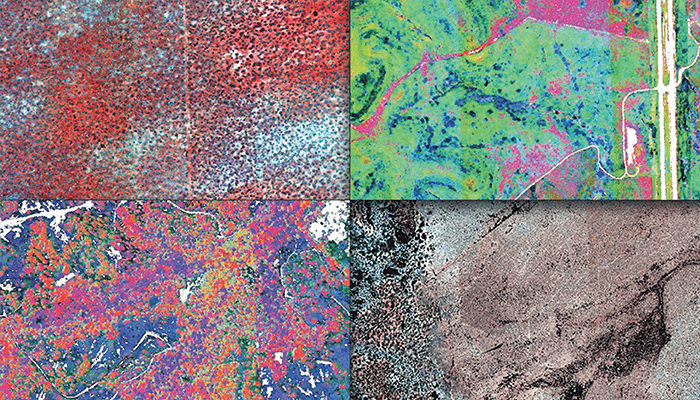
We found that spectral diversity at a spatial resolution of 20x20 m reveals changes in plant community composition – or beta-diversity – within research sites ranging from arctic tundra to tropical forests. And that means that it should be possible to monitor most ecosystems using spectral data. It’s really very exciting!
What about real-world impact? How could your findings be used to influence preventative climate change policies?
The consistent detection of changes in plant community composition across ecosystems could be used as an early warning mechanism. Spectral diversity is also a metric that can be easily calculated in an automated way from imaging spectroscopy data, which would allow us to focus our efforts on areas that need research the most and to rapidly implement interventions to prevent the most detrimental effects of ecosystem change.
Do you have any plans for future research?
Of course! There are many options to calculate spectral diversity, and it would be interesting to spend some time on comparative studies. Further testing of spectral diversity across continents and in more intensively managed landscapes would also be useful.
Newsletters
Receive the latest analytical science news, personalities, education, and career development – weekly to your inbox.

References
- AK Schweiger, E Laliberté, Nat. Commun., 13, 1 (2022). DOI: 10.1038/s41467-022-30369-6.
- University of Zurich (2022). Available at: https://bit.ly/3A7Pfo6.