Light scattering detectors play an important role in gel permeation chromatography and size exclusion chromatography (GPC/SEC) analysis because of their ability to directly measure molecular weight distribution. Multi angle light scattering (MALS) detectors are often chosen, in some instances because they provide the most accurate data for the measurement of the radius of gyration (Rg), and in others because they have become an accepted industry standard. The launch of Malvern Instruments’ new Viscotek SEC-MALS 20 detector extends commercial choice in this area and draws the technology into the spotlight.
In this article Mark Pothecary, Product Manager, Nanoparticle and Molecular Characterization, at Malvern Instruments explains how MALS detectors work, reviews their benefits for certain applications and highlights specific features that define performance. The resulting article provides a guide as to when MALS is the best choice and helps those investing in a new detector to make an informed choice.
An introduction to light scattering
Light scattering detectors are increasingly incorporated within GPC/SEC systems to accurately measure molecular weight without the need to resort to traditional external calibration methods. Furthermore when combined with additional detectors, such as a viscometer, they can be used to generate information on structural characteristics such as conformity and polymer branching.
When a molecule is irradiated with a beam of light, the intensity of the light scattered is directly related to its molecular weight, a relationship described by the Rayleigh equation. Application of the Rayleigh equation is substantially simplified if scattering intensity is known at an angle of 0° to the beam of incident light. However measuring at this angle is infeasible as the scattered light signal is indistinguishable from the incident beam.
Over the years different light scattering technologies have been developed which address the issue of not being able to physically measure at a 0° angle in different ways. Detector options include: Right Angle Light Scattering (RALS), Low Angle Light Scattering (LALS) and Multi Angle Light Scattering (MALS). Molecules can be classified on the basis of their light scattering behavior as either isotropic or anisotropic light scatterers and this has an important bearing on detector choice.
Small molecules (typically defined as those with less than 10-15nm in size) scatter light at the same intensity at all angles. For these isotropic scatterers the scattered light can therefore be detected at any angle. For larger anisotropic scatterers, however, the intensity of the scattered light exhibits angular dependence. This makes the problem of not being able to measure at 0° a more complicating issue.
LALS is arguably the most consistently reliable detector choice for all types of larger molecules [1]. However MALS is widely employed within a number of applications as a result of the confidence afforded by multiple measurements and the technique’s unique ability to accurately measure radius of gyration (Rg) - a useful parameter for describing polymer size that also contains information on structure. This has led some industries, most notably those working with proteins and in the biopharmaceutical arena, to standardize on MALS detection. Understanding how MALS detectors work and the benefits and limitations of different detection systems is important for researchers looking to optimize their application of the technique.
Determining molecular weight by MALS
As the name suggests MALS involves the measurement of light intensity at multiple angles around the molecule, rather than just at a single one. These measurements are used to build a model of the pattern of scattered light as a function of angle, which can be used to extrapolate to a value for scattering intensity at 0°. This extrapolation is carried out using a Guinier plot (also frequently called a Debye plot). This is a plot of Rayleigh ratio, a quantity that includes the value of scattered light intensity, as a function of angle relative to the incident beam (see figure 1). The y-intercept of this plot yields the scattering intensity at an angle of 0° and Rg can be calculated from the gradient.

Figure 1: A Debye plot, which plots the Rayleigh ratio as a function of sin2 (θ/2). The y-intercept of the plot equates to the Rayleigh ratio at 0o
The simplest MALS detector measures intensity at only two points. Such systems offer the smallest flow volume, and hence retention time, and as a result of their simplicity, are the most inexpensive MALS detectors available. However only incorporating two angles of detection makes it difficult to create a dependable calibration curve, especially when the Debye plot is not linear, as is often the case. In many instances the reliability of the results from two detector systems is low because the quality of the extrapolation and fit are poor.
Modern MALS systems tend to have a significant number of detectors, with the most sophisticated incorporating as many as 20. They are therefore capable of fitting more complex curves to the scattering pattern than a simple straight line. This is particularly important at lower angles where non-linear behavior can significantly affect the measured molecular weight. These systems generate more accurate molecular weight and Rg data than their two-detector counterparts. The number of detectors is often a common focus when it comes to selecting a detector but it is important to recognize that while measuring at a greater number of angles increases the likelihood of achieving a robust extrapolation, it is the quality of detectors at lower angles that contributes the most to improving accuracy.
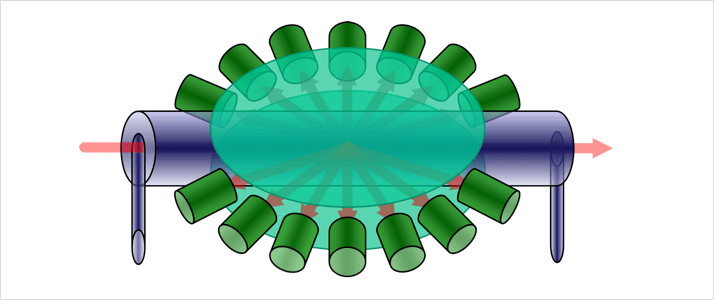
Figure 2: Traditional MALS detectors utilize lateral flow cells with the sample entering along the same plane as the beam of incident light.
Evolving MALS detector design
As the number of detectors incorporated into MALS system has increased, MALS instrumentation has become more technically complex. The need to accommodate detectors without reducing signal-to-noise has been critical in shaping detector design. To this end manufacturers have developed a number of alternative configurations, incorporating different flow cell designs and other features which have substantially improved the accuracy of MALS technology.
A primary feature of any MALS system is the flow cell, in which the sample is measured by the detectors. Traditional MALS systems employ lateral flow cell designs in which the sample runs horizontally past the detectors. The incident laser beam enters via the end of the flow cell and passes through it in the same direction as the mobile phase. The detectors are arranged in the plane of the flow with a lens used to focus the light on to all of them.

Figure 3: In the vertical flow cell, the light always exits the cell at 90° minimizing the noise and removing the need for refractive index corrections.
A lateral flow design accommodates a large number of detectors but doesn’t necessarily provide optimum low angle sensitivity. With this configuration a large flow cell must be used to accommodate higher numbers of detectors. A larger flow cell takes up significantly more room and limits the physical space available for detectors at low angles. Furthermore, the shallow entry and exit angles that result mean that low angle measurements often have a very poor signal to noise ratio, reducing the accuracy of the measurement. Finally when different mobile phases are used the resulting change in refractive index requires the use of different lenses to correct for the entry and exit angles.
Newer MALS detectors as exemplified by the Viscotek SEC-MALS 20 from Malvern Instruments have focused on the use of vertical flow cells to address the limitations of a lateral cell design. In this configuration the mobile phase and the laser are perpendicular to one another. As with the lateral system this setup can accommodate a large number of angles. However this design affords more physical space to make measurements at low angles, thereby improving the potential for accurate measurement.
In a vertical flow cell design the scattered light exits perpendicular to the cell wall, minimizing the noise generated at the interface between the mobile phase and cell wall. Furthermore, a change in mobile phase refractive index will not affect the measurement angle. This means that a single flow cell will work with any solvent, of any refractive index
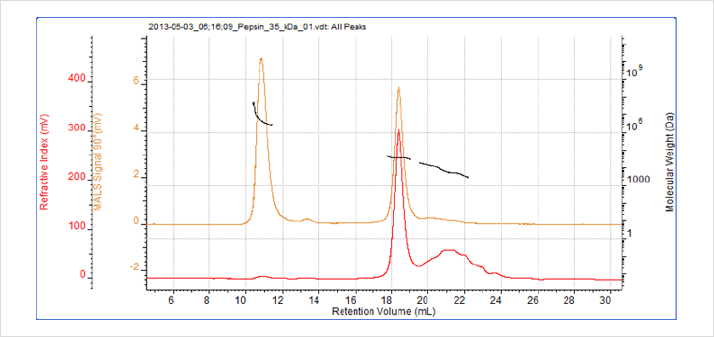
Figure 4: Chromatogram of pepsin. The peak at 34.5 kDa corresponds with the known molecular weight of pepsin while the previous peak is attributable to aggregation.
Case study – Applying MALS in the measurement of protein aggregation
Protein aggregation is recognized as a major issue within the biopharmaceutical industry and elsewhere. Proteins have a tendency to aggregate over time and a risk for biologic drugs, such as polyclonal and monoclonal antibodies, is that the presence of aggregates will reduce efficacy and potentially stimulate an immune response. GPC/SEC systems are often used to measure the molecular weight of proteins and detect and characterize any aggregates present. The following case study illustrates the application of a MALS detector to investigate protein aggregation [2].
A Viscotek SEC-MALS 20 detector was connected to a Viscotek TDAmax (both Malvern Instruments, Malvern, UK) a GPC/SEC system that incorporates a multi-detector array, to characterize samples of pepsin. Pepsin is an enzyme produced by chief cells within the stomach. Samples were dissolved in a mobile phase of phosphate-buffered saline prior to analysis.
GPC/SEC analysis of the pepsin sample indicates two distinct peaks. The molecular weight for one species was measured as 34.5 kDa, which corresponds to the known molecular weight of pepsin, 35 kDa. The other peak has a much higher molecular weight, identifying the material as an aggregated species. A poorly defined third peak, with a molecular weight of approximately 6kDa, is also present. As a digestive enzyme it is quite likely that the pepsin within the sample has begun to digest itself and that the third peak represents some of the degradation products.
Despite producing a significant light scattering peak the aggregates within the sample account for less than 1% of the total material. Identifying and quantifying such compounds within a drug sample is vital for drug development and adhering to the stringent regulatory standards applied to pharmaceuticals.
While the pepsin monomer is too small for Rg measurement the MALS plot indicates that the aggregated material is a strongly anisotropic light scatterer. This makes it possible to calculate an Rg for the aggregated species (see Table 1).

Table 1: Parameters calculated for the analysis of pepsin. The use of MALS enabled the calculation of radius of gyration for the aggregate component.
Focusing on MALS
MALS is one of a number of GPC/SEC light scattering techniques currently employed throughout industry for protein, polymer and macromolecular characterization. Within the biopharmaceutical industry, MALS prevails, and in other sectors the ability to calculate Rg is especially prized. Choosing a suitable MALS detector is therefore a task faced by many. Understanding the critical features of MALS instrumentation supports this decision-making process and helps users to assess the practical benefits and value of the most recent innovations.
References [1] Malvern Instruments white paper ‘Static Light Scattering Technologies For GPC/SEC Explained’. Available for download at: www.malvern.com/slsforgpc [2] Malvern Instruments application note ‘Measuring protein aggregation with the Viscotek SEC-MALS 20.’ Available for download at: www.malvern.com/secmals20
Malvern provides the materials and biophysical characterization technology and expertise that enables scientists and engineers to investigate, understand and control the properties of dispersed systems. These systems range from proteins and polymers in solution, particle and nanoparticle suspensions and emulsions, through to sprays and aerosols, industrial bulk powders and high concentration slurries. Used at all stages of research, development and manufacturing, Malvern’s instruments provide critical information that helps accelerate research and product development, enhance and maintain product quality and optimize process efficiency. Our products reflect Malvern’s drive to exploit the latest technological innovations. They are used by both industry and academia, in sectors ranging from pharmaceuticals and biopharmaceuticals to bulk chemicals, cement, plastics and polymers, energy and the environment. Malvern systems are used to measure particle size, particle shape, zeta potential, protein charge, molecular weight, mass, size and conformation, rheological properties and for chemical identification, advancing the understanding of dispersed systems across many different industries and applications. www.malvern.com Material relationships http://www.malvern.com/en/
Company profile
Malvern Panalytical technologies are used by scientists and engineers in a wide range of industries and organizations to solve the challenges associated with maximizing productivity, developing better quality products and getting them to market faster. Our mission is to create superior, customer-focused solutions and services to deliver tangible economic impact through chemical, physical and structural analysis of materials.
Underpinned by extensive industry knowledge and technical and applications expertise, Malvern Panalytical instruments help users better understand a wide variety of materials, from proteins and polymers to metals and building materials. Our technologies enable the measurement of parameters such as particle size, shape and zeta potential, biomolecular interactions and stability, rheological properties, elemental concentrations and crystallographic structure. Highly reliable and robust characterization of these properties is fundamental to predicting how a product will behave during use, to optimizing its performance and achieving manufacturing excellence.
Markets Served
Malvern Panalytical products and solutions for Discovery, Research & Development, Process Control, and Product Quality Assurance are sold primarily into four market sectors: Pharma/Food/Bio, Metals/Mining/Minerals, Chemicals/ Petrochemicals, and Advanced Materials sector which includes many academic and government research facilities around the world.
Company Background
Malvern Panalytical was formed by the merger of the businesses Malvern Instruments (Malvern, UK) and PANalytical, including ASD and Claisse (Almelo, the Netherlands) on 1st January 2017, and employs over 2,000 people worldwide. With R&D and manufacturing sites in North America, Europe and China, and a global sales and service presence, Malvern Panalytical provides unrivalled levels of customer support.
Malvern Panalytical is a leader in the materials characterization market, developing expert analytical solutions which deliver superior actionable insight.
www.malvern.com
Newsletters
Receive the latest analytical science news, personalities, education, and career development – weekly to your inbox.
