Coatings and films play an important role in many fields of application (drug delivery coatings, coatings on medical devices, thin films for food protection etc.), which makes an efficient technique for the investigation of these materials essential. Confocal Raman Microscopy is a powerful tool for nondestructively imaging the chemical composition of heterogeneous components within a film or coating. The confocal setup not only provides the highest spatial resolution, but also allows the acquisition of depth profiles ideally suited to the threedimensional characterization of polymer films and coatings without sample preparation.
Instrumentation & Experiment
The Confocal Raman Microscope alpha300 R combines a highly sensitive confocal microscope and a high-transmission Raman spectroscopy system. With a resolution down to 200 nm at each image pixel, a complete spectrum is typically acquired in only 10 to 100 ms. The number of image points (spectra) is limited only by the computer memory. A typical image consists of 10,000 (100 x 100) to 65 536 (256 x 256) spectra. An image is generated from this multi-spectrum file by integrating over a specific Raman line or a region in all spectra. As all spectra are stored in memory, a variety of properties such as peak-width, center of mass or peak position of certain Raman lines can be calculated from a single measurement. For depth profiling measurements, the focal plane can be moved in the z-direction when performing either xz scans or generating x-y image stacks in the z direction.

The inner polymer coating of an orange juice container was investigated in this experiment with the alpha300 R by performing an x-z scan with a scan range of 50 μm x 100 μm at 200 x 120 pixels (= 24 000 spectra) using a 100x objective (NA= 1.25). For excitation, a 532 nm Nd:Yag laser was used. The acquisition time for each spectrum was 50 ms.
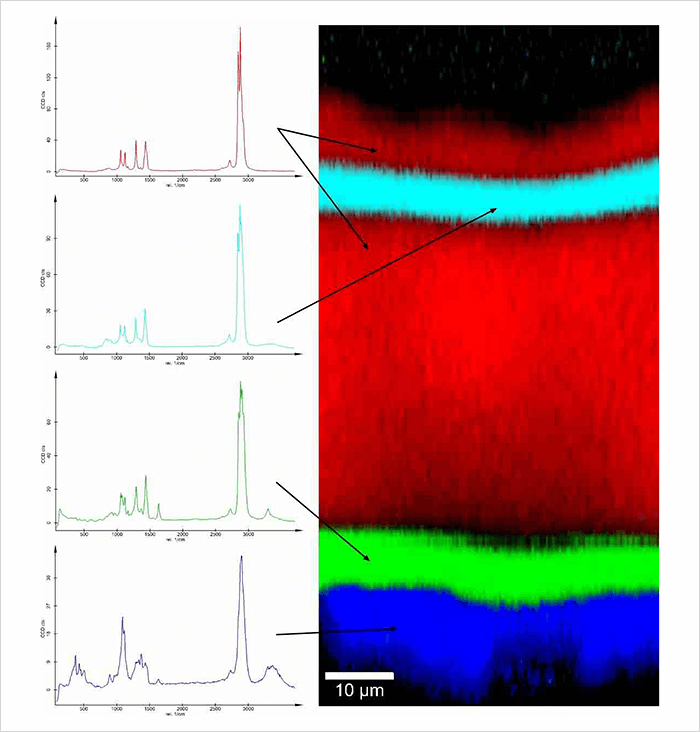 Fig. 1: Raman spectra (left) and Raman image (right) of the inner coating of an orange juice container
Results
Within the acquired multi-spectrum file, four distinct spectra can be observed (Fig.1 left). Each spectrum represents a specific chemical compound within the polymer film. The distribution of each compound can be visualized with the integrated software tools, by analyzing all acquired spectra. Fig. 1 (above) shows the resulting color-coded image, clearly revealing that the coating consists of 5 different layers although only 4 components are involved. The software also provides the ability to measure distances within the image, indicating that all layers vary in thickness.
>> Download the full Application Note as PDF
Newsletters
Receive the latest pathologist news, personalities, education, and career development – weekly to your inbox.