Conexiant
Login
  • The Analytical Scientist
  • The Cannabis Scientist
  • The Medicine Maker
  • The Ophthalmologist
  • The Pathologist
  • The Traditional Scientist
The Analytical Scientist
  • Explore

    Explore

    • Latest
    • News & Research
    • Trends & Challenges
    • Keynote Interviews
    • Opinion & Personal Narratives
    • Product Profiles
    • App Notes

    Featured Topics

    • Mass Spectrometry
    • Chromatography
    • Spectroscopy

    Issues

    • Latest Issue
    • Archive
  • Topics

    Techniques & Tools

    • Mass Spectrometry
    • Chromatography
    • Spectroscopy
    • Microscopy
    • Sensors
    • Data and AI

    • View All Topics

    Applications & Fields

    • Clinical
    • Environmental
    • Food, Beverage & Agriculture
    • Pharma and Biopharma
    • Omics
    • Forensics
  • People & Profiles

    People & Profiles

    • Power List
    • Voices in the Community
    • Sitting Down With
    • Authors & Contributors
  • Business & Education

    Business & Education

    • Innovation
    • Business & Entrepreneurship
    • Career Pathways
  • Events
    • Live Events
    • Webinars
  • Multimedia
    • Video
Subscribe
Subscribe

False

The Analytical Scientist / App Notes / 2019 / EPA Method 8260C Using CDS Analytical 7000C Purge and Trap

EPA Method 8260C Using CDS Analytical 7000C Purge and Trap

04/10/2019

Share

Featured Image

CDS Analytical’s 7000C Purge and Trap concentrator designed for PAL System fully automates Purge and Trap for the trace measurement of purgeable volatile organic compounds (VOCs) in water, compliant with the official International Standard Organization method DIN-EN ISO 15009, US EPA method 500 and 8000 series for VOCs in water. In this application note data is presented that the 7000C/PAL System exceeds the performance criteria set of EPA Method 8260C.

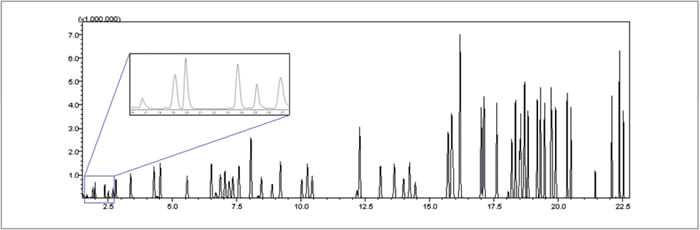
Figure 1 is the Total Ion Chromatogram (TIC) of a 200 μg/L calibration standard with internal standard and surrogates at total of 64 compounds mix. All of the analytes are adequately resolved chromatographically. The chromatogram of the six gases is enlarged in the insert in order to show the excellent separation and peak shapes.

Figure 1. TIC of 8260C volatile organic standard mix at 200μg/L with enlarged chromatogram of the six gases.
Figure 2. Overlap of eight 1,4-Dichlorobenzene-d4 runs from the internal standard module. The retention time of each peak has been shifted 1.2 seconds to show the consistency of the peak shape.
Figure 3. RRF comparison for 8260C compounds between type X trap and type K trap.
Table 1. Reproducibility of Internal Standard Addition.

The Retention Time (RT), Average Relative Response Factors (Avg RRF), Percent Relative Standard Deviation (% RSD) of the initial calibration, Method Detection Limits (MDL), along with method accuracy as Percent Recovery (% Rec) and as % RSD are obtained from 0.5 μg/L to 200 μg/L calibration standard, and all analytes exceed the EPA 8260C method requirements. The detailed data for 64 compounds is available in the full length application note.

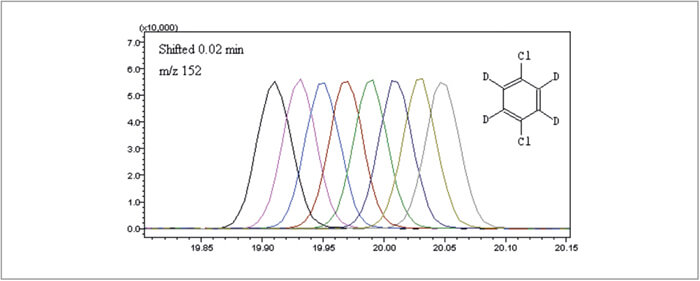
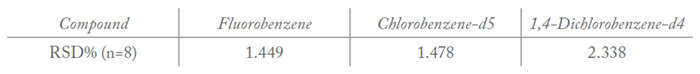
The Internal Standard Module precisely delivered 1 μL of the pre-mixed internal standard solution to each sample. The reproducibility data from 8 runs is shown in Table 1. An excellent RDS < 2.4% is reported. Figure 2 is the time-shifted overlap of 8 1,4-Dichlorobenzene-d4 runs using the internal standard module.

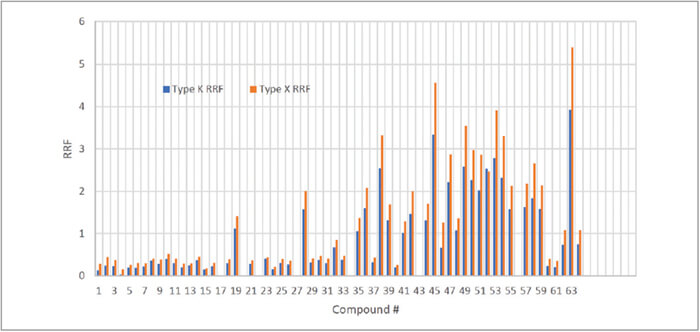
Although all the data above was collected in a 7000C with a CDS proprietary type X trap installed, a comparison test was performed against the regular type K (Vocarb 3000) trap in the same system. Figure 3 showed the RRF comparison between the two traps for all the 8260C compounds, where an average of 30% increase in RRF from type X trap is observed. Among all the 8260C compounds, 2,2-dichloropropane, which is commonly considered as a testing compounds to trace the active site in the flow path, has 48% increase in RRF from using the Type X trap.

Newsletters

Receive the latest analytical scientist news, personalities, education, and career development – weekly to your inbox.

Newsletter Signup Image

Explore More in Analytical Science

Dive deeper into the analytical science. Explore the latest articles, case studies, expert insights, and groundbreaking research.

False

Advertisement

Recommended

False

Related Content

Ionic impurities in drug products – USP proposes new ion chromatography method

January 21, 2019

Chloride and sulfate are common impurities present in drug substances and drug products...

Decoding Dangerous Drinks with a Spectral Sensor

January 24, 2019

Have you ever heard that moonshine will make you go blind? Today, even your favorite, top-shelf liquor may be just as much of a risk...

Volume Fraction Determination of Ethanol in Splash-Blended Fuel Mixture

January 24, 2019

While electric vehicles are becoming more mainstream the use of traditional gasoline engines will have a place in society for decades to come...

Cleaning Up IPA Production with Stage-by-Stage MIR Analysis

January 24, 2019

2-Propanol is one of the most common solvents in the world, with over 2 million tons produced in 2003 (Science)...

False

The Analytical Scientist
Subscribe

About

  • About Us
  • Work at Conexiant Europe
  • Terms and Conditions
  • Privacy Policy
  • Advertise With Us
  • Contact Us

Copyright © 2025 Texere Publishing Limited (trading as Conexiant), with registered number 08113419 whose registered office is at Booths No. 1, Booths Park, Chelford Road, Knutsford, England, WA16 8GS.