Conexiant
Login
  • The Analytical Scientist
  • The Cannabis Scientist
  • The Medicine Maker
  • The Ophthalmologist
  • The Pathologist
  • The Traditional Scientist
The Analytical Scientist
  • Explore

    Explore

    • Latest
    • News & Research
    • Trends & Challenges
    • Keynote Interviews
    • Opinion & Personal Narratives
    • Product Profiles
    • App Notes

    Featured Topics

    • Mass Spectrometry
    • Chromatography
    • Spectroscopy

    Issues

    • Latest Issue
    • Archive
  • Topics

    Techniques & Tools

    • Mass Spectrometry
    • Chromatography
    • Spectroscopy
    • Microscopy
    • Sensors
    • Data and AI

    • View All Topics

    Applications & Fields

    • Clinical
    • Environmental
    • Food, Beverage & Agriculture
    • Pharma and Biopharma
    • Omics
    • Forensics
  • People & Profiles

    People & Profiles

    • Power List
    • Voices in the Community
    • Sitting Down With
    • Authors & Contributors
  • Business & Education

    Business & Education

    • Innovation
    • Business & Entrepreneurship
    • Career Pathways
  • Events
    • Live Events
    • Webinars
  • Multimedia
    • Video
Subscribe
Subscribe

False

The Analytical Scientist / App Notes / 2019 / Quantitative Cannabidiol Oil Analysis with CDS Pyroprobe

Quantitative Cannabidiol Oil Analysis with CDS Pyroprobe

06/19/2019

Share

Featured Image

This application note demonstrates multi-step analysis of CBD oil, along with a reproducibility study and a cannabidiol calibration curve on concentration.

Cannabidiol (CBD) oil, from the cannabis plant, is being credited for helping treat many medical issues and has gained interest in nutraceutical and pharmaceutical industries. Analytical testing using the CDS Pyroprobe can both qualify ingredients in CBD oil and quantify analytes.

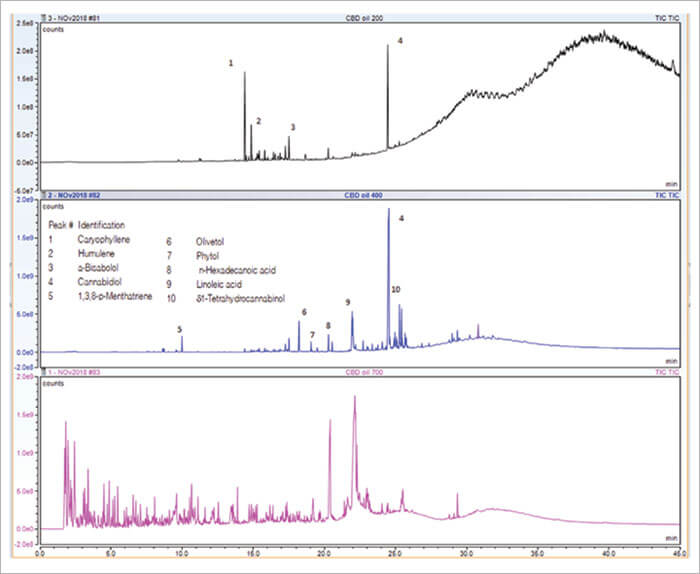
A 500 μg quantity of CBD oil was first screened with a multi-step temperature sequence of 200°C, 400°C, and then 700°C on a CDS 6000 Series Pyroprobe to reveal specific active compounds including sesquiterpenes α-Bisabolol, α-Caryophyllene, and cannabinoids (CBD and δ9-Tetrahydrocannabinol) (Figure 1).

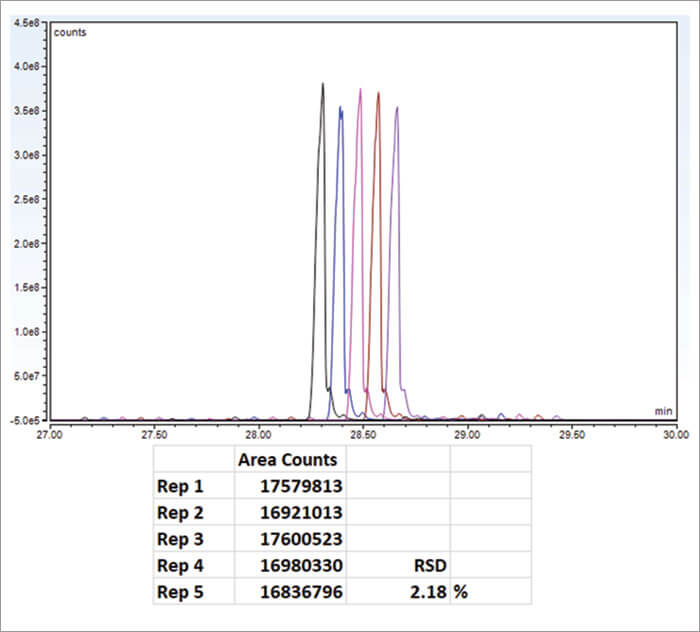
After choosing 300°C as a thermal extraction temperature for CBD, a reproducibility test was performed. Five 0.5μL aliquots of CBD oil diluted in half with hexane (for easy syringe additions) were each run at a setpoint of 300°C for 30 minutes. Replicate chromatograms are shown in Figure 2; area counts yield an RSD of 2.18 percent.

Figure 1. Multi-step analysis of CBD oil, 200°C (top), 400°C (center), 700°C(bottom).

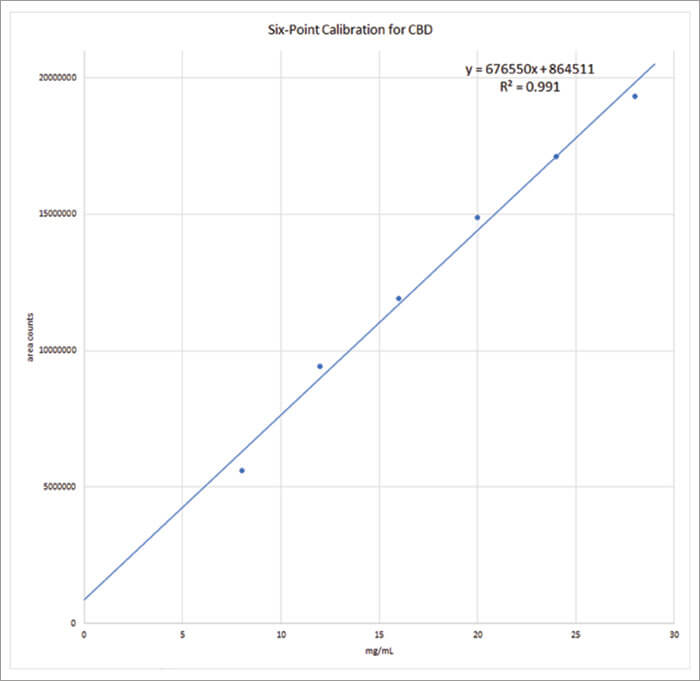
After confirming the reproducibility, a CBD calibration curve was created by running 4, 6, 8, 10, 12, and 14 μg of a CBD standard, equivalent to concentrations of 8, 12, 16, 20, 24, and 28mg/mL from a sample with fixed volume of 0.5μL. A linear regression with r2 >0.99 was observed, also shown in Figure 3. By comparing the average area of the CBD in the replicates in relation to the calibration curve, it was determined that the sample has 24mg/ mL of CBD. As the sample was diluted in half, the original CBD oil has 48mg/ mL of CBD, close to what was claimed by the manufacturer (50mg/mL).

Experimental Parameters

Samples were pyrolyzed in a DISC tube, using a CDS Model 6200 Pyroprobe.

6200 Pyroprobe

Mode: Trapping
DISC Final: 300°C hold 20min
Trap Rest: 50°C
Trap Final: 300°C 10min
Interface: 300°C
Oven: 300°C
Transfer line: 300°C

GC/MS

Column: 5 percent phenyl, (30m x 0.25mm)
Carrier: Helium, 50:1 split
Injector: 320°C
Oven: 80°C for 10 minutes, 10°C/min to 300°C
Ion Source: 230°C
Mass Range: 35-600amu

More Information

Figure 2. Time offset replicate chromatograms (m/z 231.2) and calibration curve for CBD.
Figure 3. Calibration plot for CBD.

Newsletters

Receive the latest pathology news, personalities, education, and career development – weekly to your inbox.

Newsletter Signup Image

Explore More in Pathology

Dive deeper into the world of pathology. Explore the latest articles, case studies, expert insights, and groundbreaking research.

False

Advertisement

Recommended

False

Related Content

Ionic impurities in drug products – USP proposes new ion chromatography method

January 21, 2019

Chloride and sulfate are common impurities present in drug substances and drug products...

Decoding Dangerous Drinks with a Spectral Sensor

January 24, 2019

Have you ever heard that moonshine will make you go blind? Today, even your favorite, top-shelf liquor may be just as much of a risk...

Volume Fraction Determination of Ethanol in Splash-Blended Fuel Mixture

January 24, 2019

While electric vehicles are becoming more mainstream the use of traditional gasoline engines will have a place in society for decades to come...

Cleaning Up IPA Production with Stage-by-Stage MIR Analysis

January 24, 2019

2-Propanol is one of the most common solvents in the world, with over 2 million tons produced in 2003 (Science)...

False

The Analytical Scientist
Subscribe

About

  • About Us
  • Work at Conexiant Europe
  • Terms and Conditions
  • Privacy Policy
  • Advertise With Us
  • Contact Us

Copyright © 2025 Texere Publishing Limited (trading as Conexiant), with registered number 08113419 whose registered office is at Booths No. 1, Booths Park, Chelford Road, Knutsford, England, WA16 8GS.