Introduction
This case study demonstrates the resolving and detection capabilities of size exclusion chromatography light scattering (SEC-LS) and dynamic light scattering (DLS). To mimic the appearance of small oligomers, mixtures of two different proteins were used. A 65kDa human serum albumin (Albucult, Novozymes Biopharma UK) sample was used for the monomer protein. This protein shows very good stability in its formulation buffer and is therefore a very useful DLS reference sample [1, 2]. Alcohol dehydrogenase (ADH) was used as it is similar in molecular weight to a dimer of Abucult, as ADH has a molecular weight of about 150kDa.
Experimental Methods
Stock solutions of both proteins were prepared in PBS buffer and filtered through a 0.02µm Whatman Anotop10 filter to ensure that no aggregates or dust particles were present in either sample. The Albucult sample was spiked with increasing amounts of ADH. The level of ADH is given in % of ADH (in terms of moles of ADH compared to total moles of protein in the sample). The samples were first measured by DLS on a Zetasizer Nano ZS and then duplicate measurements of 100µl of each sample were injected for analysis by SEC-LS on a Viscotek TDAmax.
Results & Discussion
The SEC-LS measurements show partial separation of the Albucult and ADH peaks as shown in the chromatograms (Figure 1) where the refractive index detector signal is shown. In a SEC experiment it would be expected that the larger protein, in this case ADH should elute first and the smaller protein, here Albucult, should elute later (at higher elution volumes). The light scattering detector was sensitive enough to detect the presence of ADH even in the 1.5% ADH sample. Neither the UV nor the RI detectors were sensitive enough to allow accurate determination of the molecular weights at this low concentration. The light scattering and RI traces were used to determine the molecular weight for samples with a level of ADH above 7.7% and, as seen in Table 1, the values determined for Albucult and ADH are close to the known molecular weight values. The determined Albucult molecular weights, as shown in Table 1, are showing an upward trend in mass due to the limited resolution of the two proteins on the column. The left edge of the Albucult peak contains an increasing proportion of higher molecular weight material as the amount of ADH increases and therefore the measured molecular weight will increase. This could be improved by using a column with higher resolving power or using multiple columns.
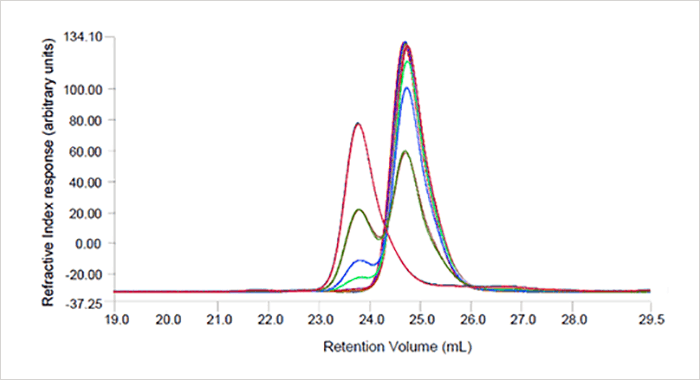 Figure 1: Chromatogram of Albucult and ADH mixtures. The two protein peaks are only partially separated.
>> Download the full Application Note as PDF
Newsletters
Receive the latest pathologist news, personalities, education, and career development – weekly to your inbox.