How did you end up working on the preservation of cultural heritage?
During my PhD at the University of Pennsylvania, I worked on the development of reagents to assist in visualizing latent fingerprints – a project done in conjunction with the US Secret Service. So I was more forensically oriented in my early career. I then spent 25 years as a chemistry professor at small liberal arts colleges, which involved more traditional work in synthetic organic chemistry.
In 1999, I became aware of a workshop offered by the National Science Foundation that connected chemistry and art. And as I was always interested in applications of chemistry – the chemistry of chocolate and things of that nature – I thought it would be interesting. So I took the week-long course and was so inspired that I decided to offer a chemistry of art course the very next fall. And that led me on a path towards getting involved in the analysis of cultural heritage objects. But initially, it was just an opportunity to teach a course for undergraduates.
In 2003, I became aware of laser-induced breakdown spectroscopy (LIBS). I thought that it would have great application in forensic analysis, given its advantages (high sample throughput, ability to see the elemental distribution in heterogeneous materials, no need for sample preparation). And I also thought it could be useful in the analysis of artworks – at least certain types of artworks. Indeed, it had already been used in this context; I read several papers at the time. I got a grant to purchase a LIBS unit (one of the early Ocean Optics instruments) and began doing some research. Around that time, I established a collaboration with scientists at the Army Research Laboratory, who were applying LIBS for hazardous material identification and so on. I then teamed up with a colleague to work on geological applications of LIBS – and that’s where you’ll find most of my publications.
To bring you to the modern day, I had two sabbaticals in the field of art and cultural heritage analysis. The first was at University College London and the Victoria and Albert Museum, where I used Raman spectroscopy and X-ray fluorescence (XRF) spectroscopy to analyze various artworks. More recently, I attended a week-long technical art analysis workshop at Yale, which led to a sabbatical in the Institute for the Preservation of Cultural Heritage (IPCH) – and then a more permanent position here. The group has since purchased a handheld LIBS instrument, which we’ve been applying to the analysis of cultural heritage objects.
Can you tell us about your work on the Vinland Map?
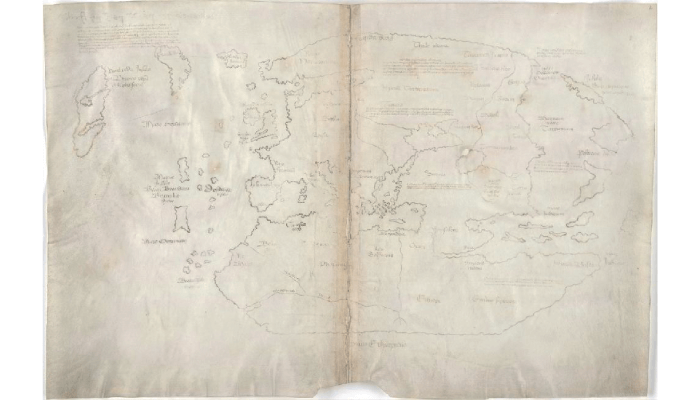
The Vinland Map was acquired by Yale in the mid-1960s and purports to be a 15th-century map of the world. It depicts the pre-Columbian “Vinlanda Insula” – a section of North America’s coastline southwest of Greenland. It’s been a rumbling source of dispute for Yale since the 1960s, with some claiming its authenticity and others – the majority – claiming that it is a fake. But when I joined Yale in 2017, they still hadn’t performed their own conclusive analysis. Other groups had analyzed the map; for example, in the 1970s, one analysis found that its ink contains anatase, a form of titanium dioxide first used commercially in the 1920s…
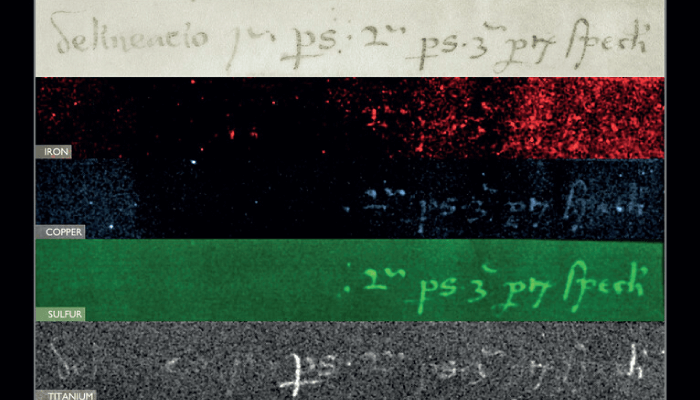
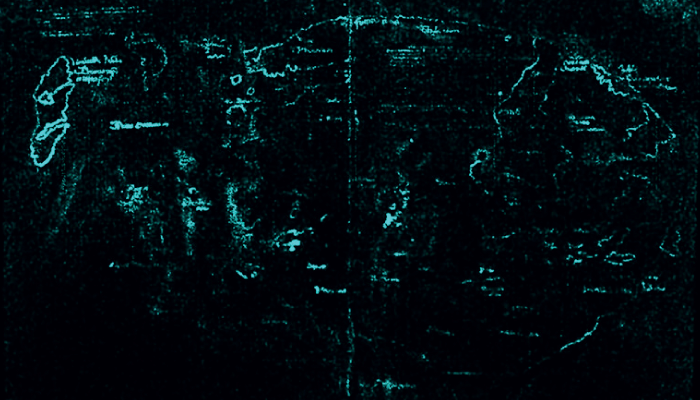
I had taught the history of the Vinland Map during my lectures as an example of a potential fake or forgery – and how we can use scientific tools to get to the truth. It was this experience that led me to become associated with the project. The goal was to use the new tools the group had acquired to unveil any additional secrets and to perhaps prove, once and for all, that it was a forgery. Until our project, some people argued that the analyses to date hadn’t hit all the right points – even though one study had looked at close to 100 different spots on the map. We used an imaging technique called scanning macro X-ray fluorescence (MA-XRF), which gave us an elemental map of the entire Vinland Map – including a graphical representation of how the various elements are distributed. We did not find iron in the map outlines or inscriptions, which means it wasn’t made with iron gall ink, the usual ink used in Europe throughout the Middle Ages. But we did confirm the presence of titanium, which is not found in appreciable quantities in other medieval inks. In fact, we looked at 50 inks from the 15th century and only found tiny amounts in some documents (because titanium can be found in clay, which can become associated with the parchment during preparation).
Interestingly, we also found that an inscription on the back of the map (in titanium ink), which had sometimes been referred to as the map’s ’title’, was written over an existing inscription in iron gall ink. We believe that the addition of text was a deliberate attempt to connect the map with a genuine medieval document. Overall, there can now be no doubt: it’s a 20th century fake that was drawn on genuine 15th century parchment!
Why do you think the forgery was created?
As with many such cases, it was most likely financially motivated. I believe the map was originally sold to a New Haven bookseller for $3,500 (a fair amount of money back in 1957). But a couple of years later, when evidence emerged that the map was associated with genuine medieval documents, the value went up by two orders of magnitude. The trail is difficult to follow, but some people certainly made a lot of money. The New Haven bookseller wasn’t forthcoming in saying what happened but his Italian counterpart (from whom he bought the book) was convicted of stealing books from the cathedral library in Zaragoza, Spain… Though that doesn’t prove he was involved in making the forgery, it provides circumstantial evidence that he was not above such activities!
Does anyone still believe the Vinland Map is genuine?
The Yale Library Curator for Early Books and Manuscripts, Ray Clemens, believes the matter is concluded beyond reasonable doubt. His goal was to make sure that cartographers, historians, and other scholars would have no cause to believe anything else. And I think he’s done that. In fact, there were plenty of other historical problems with the story anyway; Vikings didn’t make such maps – rather, historians believe they were wayfarers who navigated by stars. I suppose you could always argue that a Viking connected with someone else who made the map, but that’s a bit of a stretch… There are also problems with the Latin used in the cartography. In any case, our research should put an end to any speculation. Although science cannot definitively prove something is genuine, if we find materials that are inconsistent with the time and place that an object was supposed to be created, we can say with a very high degree of certainty that the object is not authentic.
Do you get a buzz from how analytical science is able to help piece a story together?
Absolutely! If I wasn’t a chemist, I probably would have been a historian. I took multiple history course in college, and I do enjoy all those aspects. But in essence we’re doing forensic science. We get clues, we look at the evidence, and then we try to interpret what it all means. The case of the Vinland Map was relatively straightforward; other times, finding an answer can be extremely difficult! And that’s when art history, paleography, and analytical science must all come together to piece together the full story.
What other secrets are you trying to uncover?
One project I’m currently working on involves tarot cards – and this time we’re really working with genuine 15th century objects! Most people associate tarot cards with fortune telling, but they were originally a game called in Italian trionfi and later tarocchi and are connected with our modern deck of 52 playing cards. At Yale, we have 67 out of a total of 86 cards from the Visconti di Modrone tarot deck. We’re collaborating with researchers at the Metropolitan Museum of Art to study tarot cards from several Italian institutions and the Morgan Library & Museum. The latter institution has the largest number of cards from the Visconti-Sforza tarot deck, which were made at a similar time as the cards at Yale. All of these cards are hand painted – they are essentially miniature paintings – and it has been hypothesized that the two decks were made in the same workshop, perhaps even by the same artist. We’ve been analyzing them to understand the materials used – and how our cards at Yale differ from the ones at the Morgan. This fantastic project has involved collaborations between curators, conservators and scientists all looking at different aspects of these cards; from an analytical point of view, we’ve been relying on non-destructive tools such as MA-XRF and Raman spectroscopy.
I'm also working on something a little more modern. It could be said that William Henry Fox Talbot invented modern photography, as he developed the idea of making a negative and then creating multiple prints from that single negative. Talbot was also responsible for a book called The Pencil of Nature – the first commercially published book to be photographically illustrated! Published in six fascicles between 1844 and 1846, The Pencil of Nature suffered a major problem: the photographs faded very quickly, which almost torpedoed the concept of photography. We still don’t know exactly why Talbot’s salt prints faded so quickly – and that’s what we’re exploring, using handheld XRF and other analytical tools.
Newsletters
Receive the latest analytical science news, personalities, education, and career development – weekly to your inbox.


