I testified at a trial perhaps a decade ago and was asked to explain “metabolism” to a jury. They all looked at me with what I think was dread – all except one juror who really seemed to want to know. They certainly didn’t want a complex science lecture, so I put this to them: “You eat all kinds of food for energy. That food is mostly made of carbon and hydrogen, just like coal. Of course we don’t eat coal, but we do burn coal for energy in the form of heat. We burn the food we eat to generate the energy (and heat) we need. When you burn coal you produce carbon dioxide – CO2 – the greenhouse gas (lots of head nods) and we exhale CO2 as well. Coal needs oxygen to burn – and we need it to live.
“Metabolism is that process – a process that, in all its complexity, ultimately takes oxygen and carbon and converts them to CO2 and water while producing the energy we need. Anything that interferes with that process is a metabolic disorder.”
From postmortem to newborn
During the four years of my Bachelor of Science in chemistry (Boston College), I realized that my interest lay in applied analytical chemistry – particularly with a connection to health or the environmental. I chose forensic toxicology and received my MSFS (Master of Science in Forensic Science) from the George Washington University. As it turned out, those were the two years that most influenced my life and set its direction. I roomed in the home of one of the first forensic toxicologists – Leo Goldbaum – in Washington DC. We debated science almost every night and I met many experts in the fields of both toxicology and forensic science. My research focused on the analysis of carbon monoxide (CO) in blood, and I decided I would like to pursue the laboratory side of forensic toxicology. I went for a PhD in pharmacology at the same institution, at which point my path diverged from toxicology with an emphasis on drug metabolism. My dissertation research introduced me to mass spectrometry (MS), and I developed a new MS method that essentially converted the mass spectrometer into a stable isotope detector. Essentially, you could take a labeled drug and find peaks that contained the label amongst the hundreds of metabolites that are present in urine. Once you knew where those peaks were in terms of retention time, you could reanalyze by MS to get the mass spectra and identify those compounds. My colleague (who had developed a similar method based on sulfur) and I ultimately found a new metabolite of a drug in dogs that was not known previously. A one-year post doc at University of Maryland in Baltimore (School of Pharmacy) doing MS was followed by my first job as a medical research assistant professor at Duke University Medical Center, Department of Pediatrics. While there, I did much of the research on what is now the “newborn screening by MS method” used around the world. My first task was to develop an MS-based newborn screening test for medium chain acyl CoA dehydrogenase (MCAD) deficiency, a disorder than could result in sudden death. The Duke laboratory was a clinical lab with a specialty in metabolic disorders, my colleagues having pioneered much of the work on clinical diagnostics of fatty acid oxidation disorders (of which MCAD deficiency is the most common). In brief, I had to adapt the tandem MS method that detected MCAD deficiency in liquid plasma to a method that could detect the disease from a blood sample collected from newborns. Such blood samples come in the form of a dried spot on filter paper – my first exposure to dried blood spot (DBS) analysis. The history of much of the research I performed is part of a paper I recently submitted for publication focusing on phenylketonuria (PKU), but the analysis is much broader (1).It was a challenge getting labs to accept our new test. But one group was particularly interested: a lab in Pittsburgh called Neo Gen Screening (at the time), which was run by Edwin Naylor. Naylor offered supplemental screening for a variety of conditions, some of which were amino acid disorders. Supplemental screening was offered to birthing centers in addition to the public health (state mandated) screening, but none of the tests used MS at the time. Naylor purchased the required instrumentation (tandem MS and sample preparation equipment) and training so that he could begin the first commercial application of newborn screening with tandem MS offered in Western Pennsylvania. I joined the lab to ensure the success of a method that I’d had a big role in developing and to develop and refine automated interpretation and analysis. Much of the work over the next few years was to optimize the method for large numbers of samples (500-1000 per day), to introduce new tandem MS technology and, most importantly, to develop an interpretation system that could detect multiple metabolic disorders from the MS profiles obtained for each newborn. (I am the “inventor” of five patents related to the interpretation of metabolic profiles in DBS samples from newborns.) In addition to the supplemental screening, we conducted a pilot study for the State of North Carolina to determine incidence of the 35-plus disorders we could screen for using tandem MS. Pediatrix Medical Group (now MEDNAX Health Solutions Partner) purchased the lab in 2002 and renamed it Pediatrix Screening. Pediatrix was solely focused on neonatology at the time, and newborn screening was complimentary to their goals of screening for metabolic disorders affecting preterm infants. During that time, when the analysis was robust, automated and routine, I was able to focus more on research. I shifted to the screening of a subpopulation of newborn – the premature (preterm) infant – a group that gives the highest number of presumptive positives (false positive results) as a result of their prematurity, low birth weight, immature metabolism and nutrition.
- Get out of the lab and listen to other scientists. Attend seminars in biology, biochemistry, medicine, pharmacology, forensic science, agriculture, environment.
- Find out what problems people in the field are encountering; what solutions are needed? My experience is you will hear those magic words: I wish I could measure X, Y and Z. You can then consider the problem and think about whether you can use your expertise and specialization to reach a solution.
- Don’t live in a laboratory bubble (probably good advice for any career). Technology is all around us and we can learn from other areas.
- Create a solution that is uniquely your own, whether working independently or as part of a team. Improving an existing assay with a unique solution is as important as developing a new test.
More recently at MEDNAX, we have done two clinical trials on the effect of total parenteral nutrition in infants on metabolism as observed in their metabolic profile. The goal is to develop a better newborn screen for preterm infants and the possible monitoring of their metabolism while in the NICU (neonatal intensive care unit). I have focused on the interpretation of these profiles using newer bioinformatics software, and we continue to publish in this area. Looking back, my earlier experience in forensics and toxicology has been invaluable in the field of newborn screening. Specifically, I learnt the importance of screening in the “two test rule”, where screening is performed with either a simple test or a broader profiling test that – by design – aims to pick up potential positive cases. All positive cases are then reanalyzed by a more specific confirmatory or diagnostic test. In fact, forensic and clinical screening are very similar – apart from the patient population (postmortem versus newborn). Indeed, during the screening laboratory days, we used the same metabolic profile as on sudden unexplained deaths. We found that about one percent of all infant deaths from unknown causes actually did have a cause – a metabolic disorder. We called this test the “Metabolic Autopsy” and I used to go a step further to say that newborn screening is forensic science for the living. Of course, in forensic science, the metabolites are often illicit drug metabolites or poisons, whereas in newborn screening they are endogenous biochemical metabolites (but note that a metabolite that is endogenous in nature can be a poison when at very high concentrations, as in an inherited metabolic disease).
Applied omics
Genomics is a key component of generating a biochemical or clinical profile, and is used to assess whether an abnormality is genetics-based in origin as oppose to acquired (such as an infection, or when a child is born too early or has been exposed to poisons). DNA analysis is also important in the identification of microbes/viruses. Genomics helps confirm what we observe in metabolism – and vice versa when we can confirm the expression of a mutation. In general, cost is an issue with molecular technology, because in a multiplex assay (similar to a multiple metabolite assay) each mutation needs a probe – and that can get expensive.Before the introduction of tandem MS there was no profiling in newborn screening. Essentially, you had to do eight separate single analyte tests. For a more comprehensive view of the technology evolution, look out for my upcoming paper (1). In terms of MS technology, most metabolic experts use gas chromatography-mass spectrometry (GC-MS). When used to analyze metabolites extracted from urine, hundreds of compounds can be detected in a single analysis. It is considered a diagnostic test and is quite complex. Each test takes approximately 45 minutes to run (as well as a couple hours of sample preparation). It is the quintessential metabolic profile and is still very important in clinical labs – notably, interpretation requires a great deal of expertise. Tandem MS analysis of amino acids and acylcarnitines is similar in terms of profiling, but doesn’t require chromatography and takes about two minutes per sample; diseases have different sets of metabolites. Today a positive newborn screen by tandem MS is often followed by confirmation and diagnosis using GC-MS. Modern technology in metabolomics emphasizes automated analysis from sample preparation using robotics to the analysis by MS – usually multiple tests with multiple profiles. It is also heavily dependent on software tools to process all of the data. Anything is possible with modern technology. You could obtain a blood sample (even as a blood spot) and have 3-5 profiles from 2-3 sample preparations (our current screen has two profiles plus one screening marker for Tyrosinemia type 1) all analyzed on the same tandem MS instrument. The only limits are time, sample size – and cost. And if cost is no issue, you can throw in molecular analysis as well. Beware the pitfalls. With new technology in mass spectrometry and automated analytical chemistry, the sky’s the limit when it comes to analytical. In one sense, the term TMI (too much information) should be used here. It is the old balance of “quality versus quantity”. You have to ask yourself: what are you analyzing? Do you know why? Do you know what the metabolites are? Do you know how much?
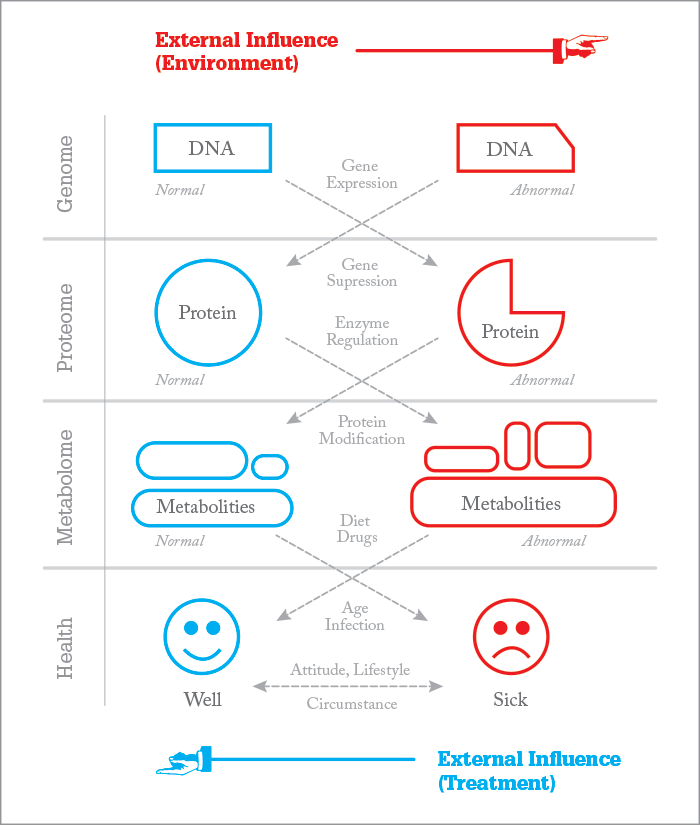
I always like to say that the gene is what we are thinking (what we want to do) but what we actually do is dependent on how we express that desire. Molecules are the instructions, metabolism is the result – and sometimes, actions speak louder than words! Notably, not all health disorders are metabolic; some are the result of defective proteins (for example, sickle cell hemoglobin) or chromosomal errors, i.e. Down’s Syndrome. Metabolomics is a broad term. For example, lipidomics analyzes a vast number of lipids to target aberrant metabolism in cells based on their lipid metabolic signature. Other studies may focus on finding drug metabolites during the screening of thousands of samples. Most metabolomics efforts are still in the research and discovery phase, whereas newborn screening or metabolic diagnostics is an actual application in metabolism – quantitative tests that use internal standards and target specific diseases that have a known signature or metabolic profile. Clinical analysis of small molecules (also called metabolites) is the same type of application. Both are subject to regulation, quality assurance programs, inspection by government or state agencies, and so on. Simply put, newborn screening for inherited metabolic disease is a subset of the broad field of metabolomics (or metabolism), no matter how you define it. The approach ultimately depends on your goals. Are you trying to understand a disease and its markers or are you developing a clinical test to detect the disease? Certainly, you must understand the disease process before you can detect the marker (see Figure 1). It really is that simple I think. What’s the best or fastest way to find and characterize disease? Well, that’s a challenge, and there are many factors involved, with cost and effectiveness at the very center. Here are a few of my thoughts on...
...complexity of samples
All biological samples (blood, plasma, urine, sweat) are complex, with hundreds of compounds. Obtaining a metabolic profile does not require measurement of each metabolite, of which there are hundreds; rather, developing an assay to detect families of compounds makes the most sense, for example: amino acids, acylcarnitines or a lipid profile. Spending time developing the proper sample collection and sample preparation system is key to success and that is much of what analytical scientists do: collecting, separating, detecting, quantifying and reporting!…quantifying markers
As noted above, I think the markers in a profile should be related and analyzed by family (amino acids or acylcarnitines, steroids or bile acids). You quantify those markers that are the most important with internal standards and semi-quantify the rest. You have software that can sort out all the normal samples, which is key – now, you don’t have to spend time focusing on those. I have always liked visual profiles for the abnormal. It is easy to see a disease that matches a quantitative result or an artifact (where the analysis was all noise or a spike in the electronics). The software can also calculate ratios of compounds or any mathematical relationship you can consider, like sums of metabolites. Some labs opt for software that provides a score in terms of certainty, but I never liked the idea that you have a 98 or 86 percent probability. Borderline results are the worst (but metabolic profiles actually help reduce these).…pinpointing disease
Any picture or profile is a signature and still requires a confirmation. Suppose you had ten artists paint their versions of the Mona Lisa and one of those was Da Vinci’s. You could only verify by a different kind of examination – using an expert who may analyze the age of the paint, for example. In terms of having the best confirmation, that is where molecular confirmation or cell culture or separate tests come into play.…visualizing results
Observing ten markers is certainly simpler than 100 or a 1000. Software is needed to assist in this matter and is critical to metabolomics. I like viewing profiles when searching for unknowns or clear abnormalities. My recent work in nutrition doesn’t simply look at very abnormal profiles that suggest toxicity or a metabolic disease (though it does do that), it also uses those quantifiable profiles to determine if nutrition is adequate or if toxic markers are accumulating. Software is critical in this case for providing a report.
…quantitation
Regardless of the analytical test, classical clinical chemistry still dictates the quantification of compounds using standards, statistical validation, reference materials and quality controls. This is a cornerstone and I think the only way to a clinical test. With metabolic profiling of urine, even by GC-MS (organic acids analysis), a lab has a reference standard to estimate quantification. Some labs doing GC-MS are now using multiple standards for true quantification. Newborn screening using MS/MS has 20-23 standards, most of which are stable isotope labeled – the gold standard in quantification using mass spectrometry. Ratios, by which I mean concentration ratios or molar ratios, require two compounds. The advantages of the ratio parameter are i) it is already based on good quantification (both compounds in a ratio have a standard reference). A ratio helps normalize a variation in blood volume in the case of dried blood spots; and ii) it better characterizes a disease like PKU, where two metabolites are connected to the same metabolic pathway. A block in that pathway should increase one metabolite while causing a decrease in another. Ratios are endogenous references and, I believe, very important in metabolic profiling. In fact, I would argue that they are essential.…false positives/negatives
False results are a problem in any clinical or forensic lab. Much more often than not, lab error is not the issue (and is reduced by good laboratory practice and QA/QC). Missing a disease is also quite rare because we interpret the results with a great deal of caution. Normal variations in metabolism between individuals/patients are quite large. To ensure you don’t miss a disease characterized by an elevation of a metabolite, you set your criteria for a positive result lower (into the upper normal range). The resulting problem is, of course, false positive results – but we tolerate false positive results in newborn screening because we want to reduce false negative results (or a missed case) down to zero. In forensic science, on the other hand, the issue of false results is reversed, as a false positive implicates a result that is not true. The goal in forensic science is to find the truth, hence detecting a drug that is not present is obviously not desirable. False results create issues such as increased costs, due to repeat testing and follow-up, hence a technology that can reduce these results is important. That technology is tandem MS and multiple metabolite analysis. In any profiling, screening or diagnostic test, there has to be a continuous effort, no matter how good the test, to push these false alarm rates toward zero on both sides.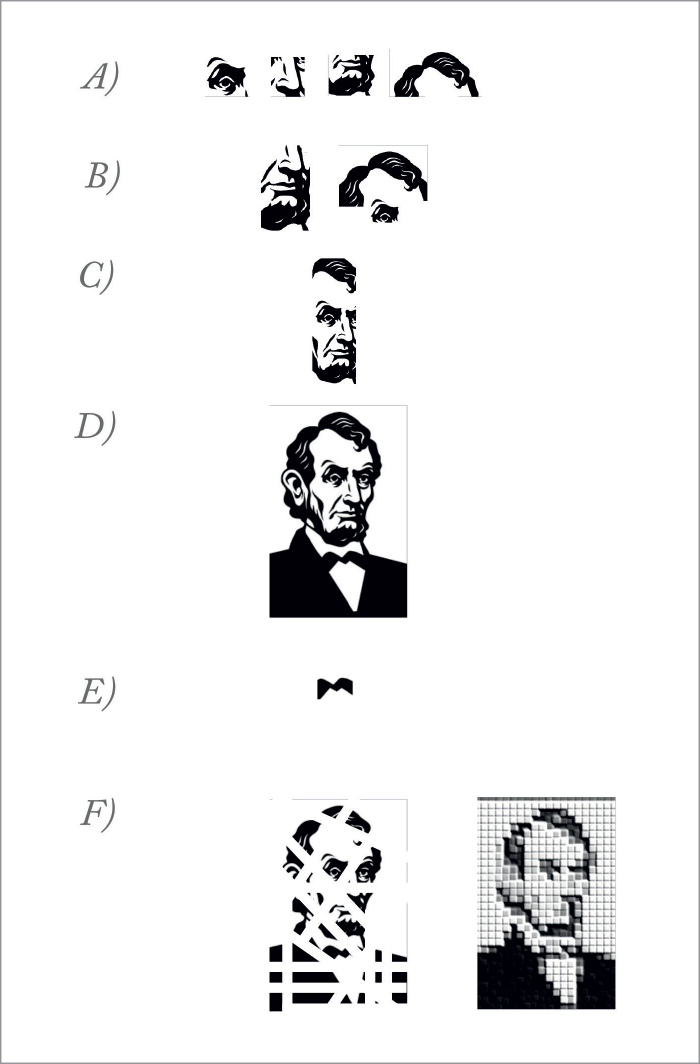
The analytical balancing act
From analytical scientists, what we need most are methods of sample preparation that can optimize the extraction (as close to 100 percent as possible) while also making samples cleaner. We also need to improve the chemistry to gain more sensitivity and selectivity in the mass spectrometer (or any other instrument for that matter). With a better instrument, the efforts in sample preparation always pay off, since the instrument will stay cleaner and be at its optimum for longer. The better the extraction and any improvements to the derivatization, the smaller the sample needed. Then the less sample needed, the more is left for other metabolic profiles or confirmation tests. With DBS, an advantage – and one that is often only realized after you begin to use it – is a cleaner extracted sample (it’s also safer from an infectious disease point of view). An organic solvent extraction usually leaves salts and other highly polar or ionic compounds behind, compounds that reduce sensitivity (and ionization efficiency). The other very important area is bioinformatics. Any commercial metabolomics platform needs to have a heavy focus on data processing and result interpretation. Although it is not necessarily obvious to an analytical scientist, often “the result” requires more than a concentration value. In medicine, interpretation is extremely important and the subsequent communication to a clinician even more so. A test with a low false alarm rate that is selective, sensitive and reasonably priced relative to its impact – and that helps the clinician make a diagnosis or improve therapy for his patients – is more likely to be ordered. And the ultimate goal of any analytical scientist should be to develop a test that is used! A good test targeted toward early diagnosis will have a positive impact on disease, by facilitating earlier treatment, prevention, or better monitoring of therapy. And ultimately, the test will reduce healthcare costs. But the reality is, unless you get the test into the hands of the physician, you’re unlikely to have any impact at all. Finally, in today’s healthcare environment, cost (or cost–benefit) is critical. A metabolic profile gives you more bang for your buck, but you also have to make sure you aren’t performing more tests than necessary or providing information that is not desired or needed. Scientists really do have to perform a unique balancing act when it comes to analytical research and development.Donald Chace is Director, Pediatrix Analytical, Mednax Centers for Research, Education and Quality; and a guest researcher at the Newborn Screening and Molecular Biology Branch, Centers for Disease Control and Prevention (CDC), based in Massachusetts, USA.
Newsletters
Receive the latest analytical science news, personalities, education, and career development – weekly to your inbox.

References
- D Chace & WH Hannon, “Technological Journey from Colorimetric to Tandem Mass Spectrometric Measurements for Phenylketonuria Detection” [NOT YET PUBLISHED] Donald Chace is Director, Pediatrix Analytical, Mednax Centers for Research, Education and Quality; and a guest researcher at the Newborn Screening and Molecular Biology Branch, Centers for Disease Control and Prevention (CDC), based in Massachusetts, USA.