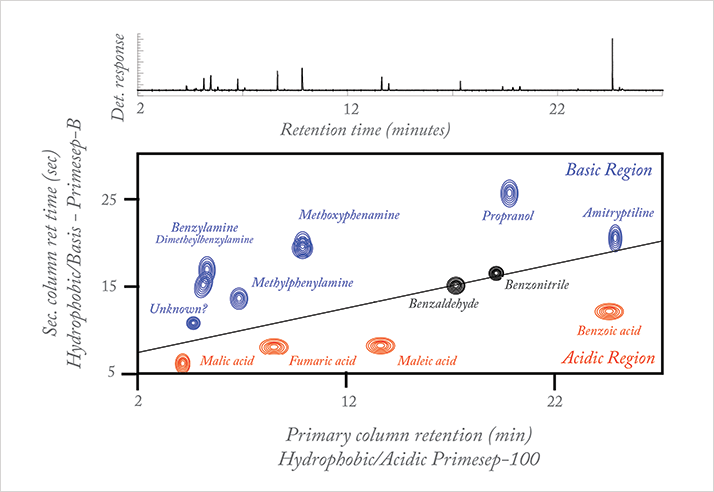
At graduate school, I became fascinated by the research of the late professor John B. Phillips, who invented a comprehensive two-dimensional gas chromatographic (GC) system in early 1990. My two-dimensional journey began with me joining his group; I was extremely excited about the prospect of sampling entire primary column eluent into the secondary column for further separation using complementary phases. I devoted much of my graduate research to 2D-GC – in particular, separations of petroleum samples. A highlight was the resolution of over 4,000 sample components in a petroleum sample using comprehensive 2D-GC, which fully demonstrated the potential of the technique (1). In the late 1990s, I joined a pharmaceutical company and figured it would be the perfect place to extend 2D-GC concepts to liquid chromatography (LC). However, it wasn’t until the early 2000s that an opportunity came my way and I actually got to pursue my 2D-LC goals; a case of right place, right time. Homemade 2D-LC Two-dimensional GC worked, so I knew that 2D-LC should too. The big question was, “how do I build a system?” There were no commercially available instruments, but luckily we had multiple HPLC systems sitting side by side, so it really was a matter of configuring them and designing a 2D-LC interface to transfer primary column eluent to the secondary column. To cut a long story very short, I put together a system using a 12 port dual position valve and published the work back in 2003 (2). The paper highlighted several different 2D-LC setups, including single and dual columns in parallel in the second dimension, multiple detectors – amongst other things. In fact, what we were doing back then is very similar to current research in multidimensional LC. I guess we were ahead of our time! Of course, building your own system presents challenges. One of the problems was the noise generated by back and forth switching of the valve, which made it difficult to discern co-eluting impurities from noise spikes. I needed to fully synchronize the valve timing, which was no small feat given system constraints. I had to integrate a high-speed electronic timer that, once triggered, would automatically and reproducibly start the switching sequence every 30, 60, or 90 seconds as per project needs. To summarize, I had to take into account three main considerations: (i) how do I configure the two HPLC systems so that they can communicate, (ii) how do I successfully take a fraction from the primary column and focus it at the head of the secondary column for further separation, and (iii) how do I reduce the baseline noise created by valve switching. And that’s before we even got any data. Retrieving the two-dimensional data from the 2D-LC system was equally challenging. The HPLC systems gave a series of detector responses as a function of primary column retention time. The second dimension’s retention time was a real missing link. This had to be manually recreated in Excel taking into consideration the data acquisition frequency and the switching frequency of the valve (3, 4). A 2D contour plot of a sample mixture made of acidic, basic, and neutral compounds resolved on mixed mode stationary phases in two-dimensions, acidic in primary and basic in secondary, is shown in Figure 1 (4). The sample components are separated into acidic and basic zones with the neutrals along the diagonal. The location of sample components in the two-dimensional plane reflects its chemical nature.
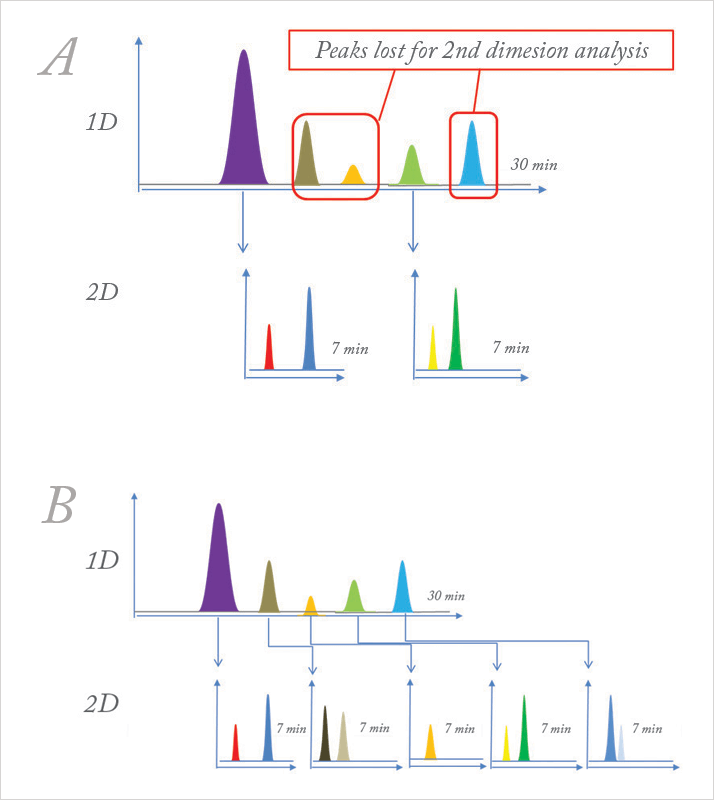
So, despite the challenges, we still got great data to demonstrate the concept, which made the extra efforts worthwhile. Funnily enough, we were using sub-2 µm columns even back then for some of our proprietary, unpublished work without realizing one day it would emerge into what is commonly known as sub-2 µm chromatography. We just knew we needed to use columns with small particle sizes (1.8 µm) for high-efficiency, high-speed separations. In short, 2D-LC required significant creativity and hard work on our part in those early years but, in return, provided excellent rewards. Taking 2D-LC to the next level I was using my homebuilt system until about two years ago when Agilent introduced its own 2D-LC-MS model. Now, researchers like myself don’t need to worry about many of the problems we faced. 2D-LC has become a very seamless and intuitive process; it’s no longer a research tool in the hands of few researchers but a commercial tool with repetitive gradient capability. Each gradient starts at progressively higher organic strength than the previous gradient, improving efficiency. Previously, I was forced to use shallow gradients in both dimensions, but in modern systems, repetitive gradient programming is almost unlimited, which opens up a whole new range of applications. In pharmaceutical analysis, we are particularly interested in resolving and identifying any trace co-eluting impurities in the midst of the main active pharmaceutical ingredient. But because chemical components that elute in the proximity of the main peak are often similar in structure (or isomeric), developing a specific and sensitive HPLC method can be difficult and conventional detection techniques like the diode array detectors (DAD) and MS have their limitations. Furthermore, the concentration levels of these impurities are often a few orders of magnitude lower. It’s like trying to look at a main component peak the size of the tallest structure in the world (the Burj Khalifa in Dubai) whilst not wanting to miss an impurity the size of a pedestrian on the street beneath it. Using 2D-LC, we get a second chance to find any co-eluting components by using another mechanism of separation in the second dimension. That’s a major advantage for the pharmaceutical industry. In small molecule pharmaceutical science, impurity analysis confined to the proximity of main component does not warrant a fully comprehensive 2D-LC run. We tend to adopt a selective or pseudo comprehensive method (which is somewhat like extended heart-cutting). Currently, as we can only generate secondary chromatograms every 30 or 60 seconds, we slow the primary column flow rate (for example, from 1 ml/min to 0.05 ml/min) over the course of the main peak, which allows us to send more fractions to the secondary column. A recent innovation introduced at HPLC 2014 by Agilent is the peak parking solution for multiple heart-cutting, which allows the collection and storage of multiple fractions in 12 sample loops that can then be analyzed sequentially (see Figure 2). Using it, we should no longer need to slow the flow in the first dimension. I believe it will be of great value in the pharmaceutical industry. We are awaiting our demo version.
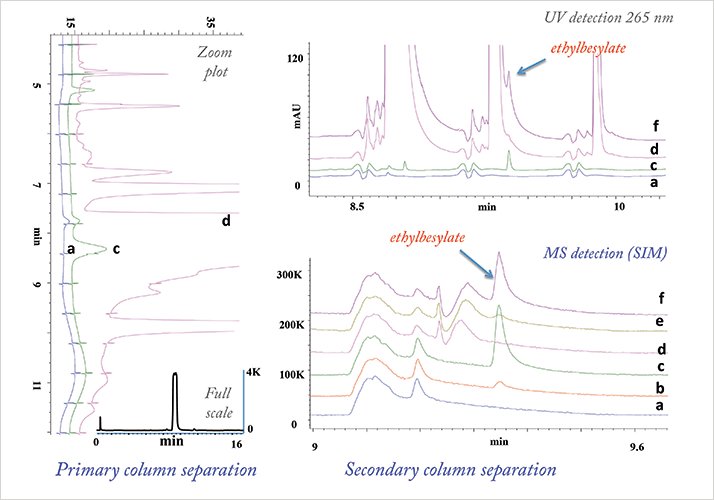
Another example of 2D-LC’s potential in pharma is assessing MS incompatible methods for potential co-elution. You can take a small portion of the non-MS compatible mobile phase from the primary column and introduce it onto the secondary column for further separation without impacting the MS. I also see potential application of 2D-LC in the analysis of genotoxic impurities, which have significant bearing on patient health and must be quantified at very low levels. Application of 2D-LC-MS in the analysis of co-eluting genotoxic impurities is shown in Figure 3. Ethylbesylate, a genotoxic impurity co-eluting in the midst of API peak in the primary column, is partially resolved in the second dimension using UV detection. Use of specific, sensitive detector like MS enables the detection of the co-eluting impurity, which differs in concentration by more than four orders of magnitude, demonstrating the power of 2D-LC.
Achiral/chiral analysis is another area where 2D-LC could play a pivotal role, especially with increased numbers of chiral centers. We demonstrated the proof of concept in our earlier work on simultaneous, achiral/chiral analysis using 2D-LC (5). In the future, I am positive that 2D-LC will be used to assess stability indicating methods for co-elution and as a feedback mechanism to optimize or improve routine methods. By embracing 2D-LC as a research tool earlier in development, I believe we can produce more robust stability indicating methods. Given the advantages, I would not be surprised if 2D-LC starts to take center stage in the next 5-7 years – especially, if regulatory agencies take a firmer stance and scrutinize stability-indicating analytical methods for potential co-elusion. Cadapakam J. Venkatramani is Senior Scientist at Small Molecules Pharmaceutical Science, Genentech Inc., San Francisco, CA, USA.
- Know your sample.
- Ask yourself, “what am I trying to achieve?” and “will 2D-LC help solve my problem?”
- Review the literature. Find out what has been done before; do not reinvent the wheel.
- Find out what instrumentation is commercially available; make things easy on yourself.
- Experiment and have some fun playing around.
Newsletters
Receive the latest analytical science news, personalities, education, and career development – weekly to your inbox.

References
- C. J. Venkatramani and J. B. Phillips, “Comprehensive two-dimensional Gas Chromatography Applied to the Analysis of Complex Mixtures”, J. Microcolumn Sep. 5, 511-519 (1993). C. J. Venkatramani and Y. Zelechonok, “An Automated Orthogonal Two-dimensional Liquid Chromatograph”, Anal. Chem. 75, 3484–3494 (2003). C. J. Venkatramani and A. Patel, “Towards a Comprehensive 2-D-LC-MS Separation”, J. Sep. Sci. 29, 510-518 (2006). C. J. Venkatramani and Y. Zelechonok, “Two-dimensional Liquid Chromatography with Mixed Mode Stationary Phases”, J. Chromatogr. A 1066, 47-53 (2005). C. J. Venkatramani et al., “Simultaneous, Sequential Quantitative Achiral-Chiral Analysis by Two-dimensional Liquid Chromatography”, J. Sep. Sci. 35, 1748-1754 (2012).