A Malvern Instruments' Bioscience Development Initiative
Executive Summary
Dynamic light scattering (DLS) is an analytical technique used to measure the particle size distribution of protein formulations across the oligomer and sub-micron size ranges of approximately 1 nm to 1 µm. The popularity of DLS within the biopharmaceutical industry is a consequence of its wide working size and extended sample concentration ranges, as well as its low volume requirements. With that said, the challenge that remains with the application of DLS to protein therapeutic formulations is centered around data interpretation. In this four-part white paper series, common issues and questions surrounding the principles, measurements and analysis of DLS data are discussed in order to help minimize the time required for and complexity of acquiring and interpreting DLS data that is critical throughout the development process. In this fourth white paper of the series, we address frequently asked questions related to the application of DLS to the characterization of protein therapeutic formulations.Dynamic Light Scattering
In a DLS measurement, scattering intensity fluctuations are correlated across small time spans, yielding a distribution of diffusion coefficients, which is subsequently converted into an intensity weighted particle size distribution using the Stokes-Einstein equation. Over the past few decades, DLS has transitioned from an esoteric academic R&D tool into a mainstream technology routinely used for purposes such as protein aggregate screening and bioformulation stability & stress testing. This transition has not been absent of challenges, particularly in the area of data interpretation, and as the technology is introduced into more and more new application areas, the importance of recognizing the limitations of DLS cannot be overstated. This document addresses frequently asked questions regarding DLS data interpretation, including:- What is the precision of a DLS measurement?
- What is the accuracy of a DLS measurement?
- What is the resolution of a DLS measurement?
- What is the minimum sample concentration for DLS?
- What is the maximum sample concentration for DLS?
- Is it better to use longer run times?
- What is the effect of fluorescence on DLS measurements?
- What is the effect of scattering angle on DLS results?
- How accurate is the DLS volume distribution?
- What is the hydrodynamic radius?
- Can the molecular weight be measured with DLS?
What is the precision of a DLS measurement?
The precision or repeatability of a DLS measurement is dependent upon the property being monitored. The most robust property derived from a DLS measurement is the Z average size, which is calculated directly from the decay rate of the intensity correlation function, using known physical constants and sample/instrument properties. The robustness of the intensity weighted Z average also makes it the most repeatable of the various sample properties derived from a DLS measurement. Figure 1 shows a comparison of various DLS-derived intensity and volume based parameters for repeat measurements of a 300 nm latex standard in a Malvern Zetasizer Nano ZS system, with the values in parentheses being the relative standard deviation of the 15 measurements. As noted in these results, the Z average size derived from DLS has a precision of better than 1%.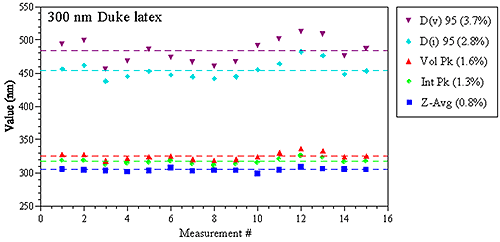
Figure 1: Replicate DLS measurement results for a 300 nm latex size standard
What is the accuracy of a DLS measurement?
The Z average size derived from a DLS measurement is the intensity-weighted hydrodynamic size of a particle. As implied by the definition, the Z average is influenced by hydration or solvation effects. Transmission electron microscopy (TEM), the technique generally used to confirm the size of latex standards, produces a number-weighted average size of a dehydrated hard sphere. Despite the subtle differences in the measured parameters, accuracy in DLS measurements is often quoted in relation to TEM-validated latex sizing standards. To gain answers to the remaining FAQs, read the full white paper by clicking hereMalvern provides the materials and biophysical characterization technology and expertise that enables scientists and engineers to investigate, understand and control the properties of dispersed systems. These systems range from proteins and polymers in solution, particle and nanoparticle suspensions and emulsions, through to sprays and aerosols, industrial bulk powders and high concentration slurries. Used at all stages of research, development and manufacturing, Malvern’s instruments provide critical information that helps accelerate research and product development, enhance and maintain product quality and optimize process efficiency. Our products reflect Malvern’s drive to exploit the latest technological innovations. They are used by both industry and academia, in sectors ranging from pharmaceuticals and biopharmaceuticals to bulk chemicals, cement, plastics and polymers, energy and the environment. Malvern systems are used to measure particle size, particle shape, zeta potential, protein charge, molecular weight, mass, size and conformation, rheological properties and for chemical identification, advancing the understanding of dispersed systems across many different industries and applications. www.malvern.com Material relationships http://www.malvern.com/en/
Newsletters
Receive the latest analytical science news, personalities, education, and career development – weekly to your inbox.


