To formulate successfully with hyaluronic acid (HA), it is essential to understand the impact of factors such as molecular weight, molecular structure, concentration and degree of cross-linking on rheological characteristics (for example, viscoelasticity), which are directly linked to aspects of product performance. Linking structural characteristics to product performance, via rheological properties, supports smart, fast, and effective formulation. The following study shows how rheology and particle size measurements can be used to characterize the physical properties of HA dermal fillers.
Introduction
Hyaluronic acid (HA) is a naturally occurring polysaccharide frequently used as a functional ingredient in many topical and subcutaneous anti-ageing treatments such as dermal fillers, which exploit the polymer’s unique viscoelastic properties for effective soft tissue augmentation. When administered subcutaneously, HA builds an elastic network within wrinkles and rhytides to give the skin a plumper and fuller look. Naturally occurring HA has a half-life of less than three days so increasing the durability of the polymer is essential to developing products with greater clinical persistence and an acceptable shelf life. Increasing both the molecular weight (MW) and degree of cross-linking of the polymer is a proven strategy for improving mechanical strength and extending degradation times. However, these characteristics also impact other properties of the HA, such as viscosity and viscoelasticity.To formulate successfully with HA it is essential to understand the impact of factors such as molecular weight, molecular structure, concentration and degree of cross-linking on rheological characteristics (for example, viscoelasticity), which are directly linked to aspects of product performance. Linking structural characteristics to product performance, via rheological properties, supports smart, fast, and effective formulation. The following study shows how rheology and particle size measurements can be used to characterize the physical properties of HA dermal fillers.
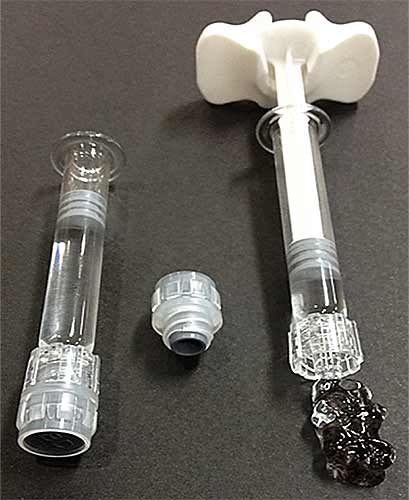
Figure 1. HA dermal fillers in syringe
Experimental
- Three commercial HA dermal fillers were evaluated using rotational rheometry and laser diffraction for characterization of rheological behavior and particle size respectively.
- Rotational rheometer measurements were made using a Kinexus rotational rheometer with a Peltier plate cartridge and using a 40mm parallel plate measuring system. All rheology measurements were performed at 25°C.
- A standard loading sequence was used to ensure that both samples were subject to a consistent and controllable loading protocol.
- Oscillation testing included variable amplitude and variable frequency tests. Amplitude sweep tests at a frequency of 1 Hz were performed to determine the linear viscoelastic region (LVER) and critical strain. Subsequent frequency sweep tests were performed between 0.1-10Hz using a constant strain within the LVER.
- Steady state shear measurements were made to check the viscosity dependence on shear rate (0.1 s-1 - 100 s-1) and a stress ramp test (0Pa - 200Pa in 100s) was also performed to determine the yield stress of the fillers.
- The tackiness of the fillers were assessed using axial testing on the rheometer which involved changing the gap rapidly from 1 mm to 20 mm and recording the normal force profile. Tack was correlated with the peak normal force measured in Newtons.
- Particle size measurements of the gel particles in the dermal fillers were made using a Mastersizer 3000. The fillers were dispersed in saline solution and the median particle size and particle size distribution determined.
Results and Discussion
Oscillation testing The elastic modulus curves as a function of shear strain are shown in Figure 2. All samples had similar size LVER regions with a critical strain representing the onset of non-linearity in the region of 20%. Elastic modulus values measured within the LVER showed that Sample A had the lowest elastic stiffness with G’ having a value of 150 Pa. Sample C was the most elastically stiff of the three samples with a G’ value of 320Pa with Sample B having a value between the two of 220Pa.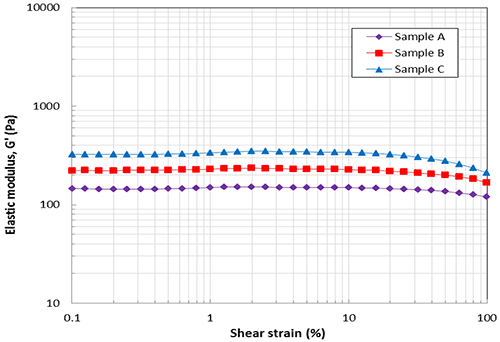
Figure 2. Amplitude sweep data showing elastic modulus (G’) as a function of shear strain The elastic modulus and phase angle curves as a function of the oscillation frequency are shown in Figure 3. The phase angle for all samples across the whole frequency range is around 10° suggesting all samples are highly elastic gels. The values of G’ for the samples A, B, and C at 1Hz are about 150Pa, 220Pa and 320Pa respectively, which correlate with the amplitude sweep data at the same frequency. The slight slope in G’ with frequency suggests a small amount of structural relaxation where stored elastic energy is dissipated with increasing time (decreasing frequencies) although this is relatively minimal.
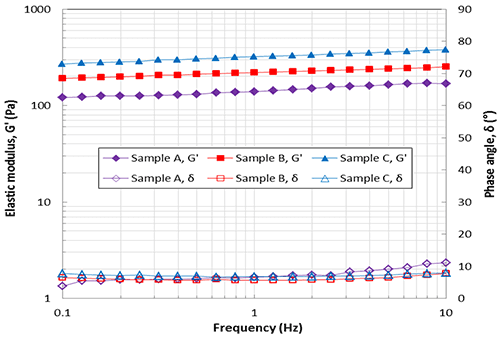
Figure 3. Frequency sweep data showing elastic modulus (G’) and phase angle (δ) as a function of frequency There are many factors that affect the viscoelastic properties of HA dermal fillers including HA concentration, molecular weight and crosslinking degree. By changing these characteristics the viscoelastic properties, especially the elastic modulus G’, can be engineered for a specific application. Gels with high G’ give higher resistance to deformation and should be more effective as fillers, but could be harder to inject and may give more pain. Therefore, strong gels with high G’ may be more suitable to use for deeper or more serious winkles. On the other hand, weaker gels with low G’ may be better for fine or light wrinkles found in lips or tear troughs, which are more sensitive, because they would give less pain when injected. The lower modulus may also better match the properties of the local tissue. Of the three HA samples tested it can be said that sample A is the weakest and softest gel and sample C is the stiffest and strongest gel based on results presented in Figures 2 and 3. Steady shear testing and yield stress determination The results of the steady state shear measurement - shear viscosity measured as a function of shear rate are shown in Figure 4. The viscosity decreases significantly with increasing shear rate indicating that the materials are highly shear thinning. Also, the structure of the fillers is so strong that at a low shear rate the viscosity is very high and continues to rise with decreasing shear rate suggesting yield stress or solid like behavior at rest. This corresponds with observations from oscillation testing which showed a highly elastic gel-like structure. A yield stress indicates that the material will behave like a solid below critical stress but will flow like a liquid above this critical stress. The magnitude of the yield stress should be related to the structural strength and hence degree of cross-linking and concentration of the gel particles, which should be reflected in G’. Yield stress can be determined using a number of different tests, however, a stress ramp is one of the quickest and easiest ways for estimating the yield stress, where the instantaneous viscosity (not steady state) is measured continuously with increasing shear stress. Stress ramp data for the three HA samples are shown in Figure 6. The peak in viscosity represents the point of yield and the stress value at which this occurs is the yield stress. Sample A has the lowest yield stress (42Pa) and Sample C the highest (55Pa) with Sample B slightly lower than C (53Pa). This is the same order observed in oscillation testing with Sample C the strongest and Sample A the weakest of the three gels. As these gels tend to exists as a collection of covalently cross-linked gel particles (as opposed to a continuous gel network) then the yield stress is associated with the stress required to ‘un-jam’ the particles and allow them to move past one another.
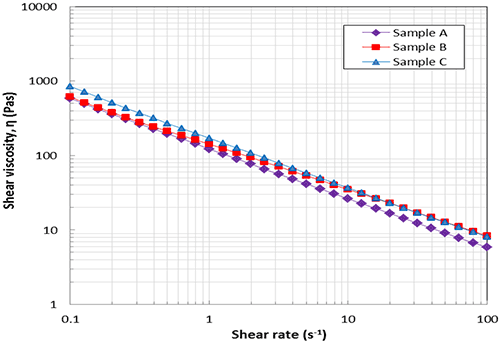
Figure 4. Flow curves showing steady state shear viscosity (η) as a function of shear rate
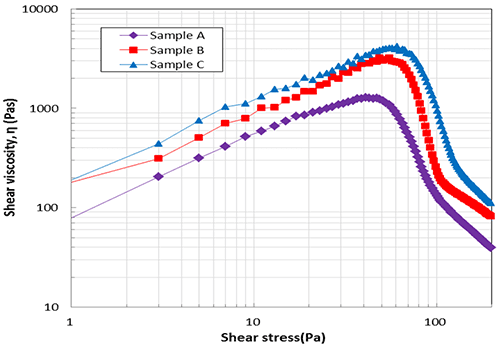
Figure 5. Stress ramp data showing instantaneous shear viscosity (η) as a function of shear stress >> Download the full Application Note as PDF
Malvern provides the materials and biophysical characterization technology and expertise that enables scientists and engineers to investigate, understand and control the properties of dispersed systems. These systems range from proteins and polymers in solution, particle and nanoparticle suspensions and emulsions, through to sprays and aerosols, industrial bulk powders and high concentration slurries. Used at all stages of research, development and manufacturing, Malvern’s instruments provide critical information that helps accelerate research and product development, enhance and maintain product quality and optimize process efficiency. Our products reflect Malvern’s drive to exploit the latest technological innovations. They are used by both industry and academia, in sectors ranging from pharmaceuticals and biopharmaceuticals to bulk chemicals, cement, plastics and polymers, energy and the environment. Malvern systems are used to measure particle size, particle shape, zeta potential, protein charge, molecular weight, mass, size and conformation, rheological properties and for chemical identification, advancing the understanding of dispersed systems across many different industries and applications. www.malvern.com Material relationships http://www.malvern.com/en/ portal@malvern.com
Malvern provides the materials and biophysical characterization technology and expertise that enables scientists and engineers to investigate, understand and control the properties of dispersed systems. These systems range from proteins and polymers in solution, particle and nanoparticle suspensions and emulsions, through to sprays and aerosols, industrial bulk powders and high concentration slurries. Used at all stages of research, development and manufacturing, Malvern’s instruments provide critical information that helps accelerate research and product development, enhance and maintain product quality and optimize process efficiency. Our products reflect Malvern’s drive to exploit the latest technological innovations. They are used by both industry and academia, in sectors ranging from pharmaceuticals and biopharmaceuticals to bulk chemicals, cement, plastics and polymers, energy and the environment. Malvern systems are used to measure particle size, particle shape, zeta potential, protein charge, molecular weight, mass, size and conformation, rheological properties and for chemical identification, advancing the understanding of dispersed systems across many different industries and applications. www.malvern.com Material relationships http://www.malvern.com/en/ portal@malvern.com
Newsletters
Receive the latest analytical science news, personalities, education, and career development – weekly to your inbox.