Introduction
In biopharmaceutical formulations one of the key factors that manufacturers need to understand is the propensity of their samples to aggregate. Aggregates in biologic drugs are undesirable for two reasons. They reduce the amount of active ingredient in the sample, thereby reducing efficacy, and they can stimulate immunogenic responses in the body. This in turn can lead to more rapid clearance of the drug and again reduce efficacy, or in some cases can lead to severe immune responses. Full characterization of protein drug samples is therefore necessary both for those developing formulations and those characterizing final products. It is therefore extremely important to have a technique which can both measure the amount of different protein aggregate components and identify and characterize each of them. In this way a sample can be fully characterized and understood. Traditionally, the determination of such information has employed size exclusion chromatography (SEC). Using SEC, sample components can be identified by their molecular weights in a process that compares the retention volume of analyte molecules through a size exclusion column against that of a series of standards with known molecular weights. In addition, the relative amounts of each component can be simply extracted from the respective peak areas providing that a concentration detector is used to record the elution and the relevant extinction coefficients are known.Although a well-established technique and an industry standard for the characterization of proteins, the use of column calibration SEC for the determination of molecular weight is not without issues. Principally amongst these are the inaccuracies introduced into the analyses through shape-dependent elution. In this application note we characterize two antibody samples using column calibration and multi-detection SEC. Here we show the outcomes of both analyses and demonstrate how multi-detection SEC - a technique that combines the resolving power of chromatography with the revealing power of light scattering detectors and a viscometer. In a multi-detection SEC system, the light scattering detectors measure absolute molecular weight (as opposed to a column calibration system that can only provide a relative measurement) and the differential viscometer provides information about the molecular structure of the protein being analyzed. This wider range of accurate data provides a more complete characterization of the protein mixtures under study is obtained.
Materials and methods
A protein molecular weight marker kit (Sigma Aldrich) comprising six globular proteins and an exclusion marker was used to prepared column calibration standards in phosphate buffered saline (PBS, pH 7.4) at final concentrations of approximately 1-3 mg/mL. In addition, two polyclonal immunoglobulin G samples (IgG, Sigma Aldrich) from different organisms were also prepared in PBS at final concentrations of 2-3 mg/ mL. All samples were filtered (cellulose acetate membrane, 0.2 μm) and three replicate injections of 100 μL were applied to the size exclusion column set (2x Viscotek P3000, Malvern, UK) using the microliter pickup mode for the most volume-economic sample delivery. All measurements were undertaken on an OMNISEC system at a flow rate of 1 mL/min using phosphate buffered saline as the mobile phase. The sample tray, column and detector compartments were maintained at 25 °C throughout data acquisition.Results and discussion
IgG chromatograms: refractive index The elution profiles of two IgG samples were monitored using a refractive indexdetector (Figure 1). An overlay of these chromatograms provides a qualitative
comparison between samples and allows differences in their relative composition to be
discerned.
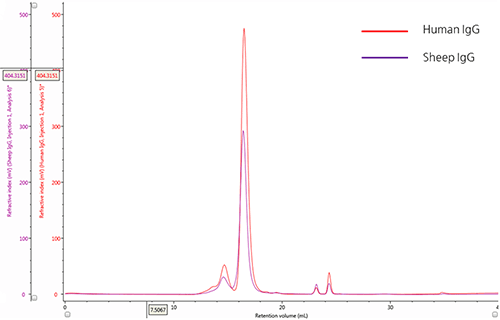
Figure 1: Overlay of representative UV chromatograms of human IgG (red) and sheep IgG (purple) The chromatograms of both IgG samples show a major peak with a retention volume (VR) at approximately 16.0 mL and also reveal the presence of multiple species at lower retention volumes. From size exclusion theory, we conclude that the peaks upstream from the main peak correspond to species that have a progressively larger hydrodynamic size and are most likely aggregates of the IgG monomer. Conversely, the minor peaks downstream of the main peak, with VR ~ 24mL, correspond with molecules with small hydrodynamic radii and are most likely salt molecules.
Characterization of IgG samples by SEC column calibration
The logarithm of the molecular weight (Log Mw) of each protein standard was plotted as a function of the ratio of the protein retention volume to the column void volume (Vo). A linear fit of the data provided the calibration parameters necessary to estimate the molecular weight values for peaks in the chromatograms of both IgG samples (Figure 2). A summary of these estimated Mw values and other quantitative attributes identified by column calibration are provided in Table 1.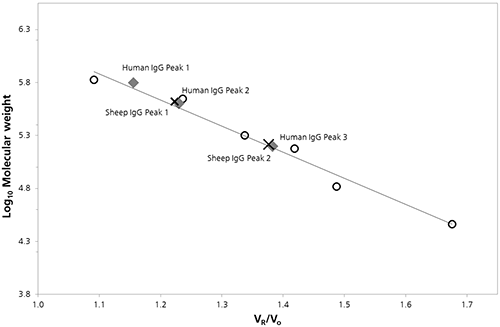
Figure 2: SEC Column calibration curve with sheep (cross) and human (diamond) IgG data superimposed Table 1: Summary of results from SEC column calibration
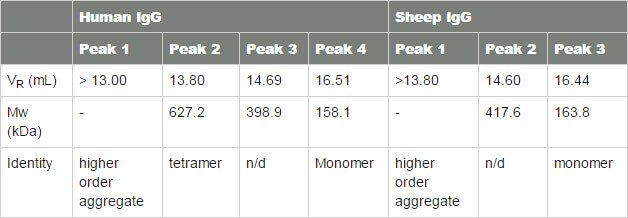
Antibody monomers have a nominal molecular weight in the region of 150 kDa. From column calibration data we observe that the estimated Mw determined for Peak 3 (human) and Peak 2 (sheep) most likely corresponds to the monomer species; although both values are slightly greater than the nominal molecular weight at 158.1 and 163.8 kDa, respectively. The peaks at lower retention volumes, 14.69 mL (Peak 2 human) and 14.60 mL (Peak 1 sheep), are not in good agreement with the dimer or trimer masses and thus cannot be definitively identified. Peak 1 (human) has an estimated molecular weight that may correspond with the tetramer mass (632.4 kDa). Click here to read the full article
Malvern provides the materials and biophysical characterization technology and expertise that enables scientists and engineers to investigate, understand and control the properties of dispersed systems. These systems range from proteins and polymers in solution, particle and nanoparticle suspensions and emulsions, through to sprays and aerosols, industrial bulk powders and high concentration slurries. Used at all stages of research, development and manufacturing, Malvern’s instruments provide critical information that helps accelerate research and product development, enhance and maintain product quality and optimize process efficiency. Our products reflect Malvern’s drive to exploit the latest technological innovations. They are used by both industry and academia, in sectors ranging from pharmaceuticals and biopharmaceuticals to bulk chemicals, cement, plastics and polymers, energy and the environment. Malvern systems are used to measure particle size, particle shape, zeta potential, protein charge, molecular weight, mass, size and conformation, rheological properties and for chemical identification, advancing the understanding of dispersed systems across many different industries and applications. www.malvern.com Material relationships http://www.malvern.com/en/ portal@malvern.com
Newsletters
Receive the latest analytical science news, personalities, education, and career development – weekly to your inbox.


