This four-part series examines common issues and questions surrounding the principles, measurements and analysis of DLS data and discusses how to minimize the time required for and increase the accuracy of acquiring and interpreting DLS data during the biotherapeutic development process. In Part One, we provide an overview of the key principles of DLS: theory, correlation statistics, deconvolution algorithms, and the intensity to mass transform.
A Malvern Instruments' Bioscience Development Initiative
Executive Summary
Dynamic light scattering (DLS) is an analytical technique used to measure the particle size distribution of protein formulations across the oligomer and sub-micron size ranges of approximately 1 nm to 1 µm. The popularity of DLS within the biopharmaceutical industry is a consequence of the technique’s wide working size and extended sample concentration ranges, as well as its low volume requirements. With that said, the challenge that remains with the application of DLS to protein therapeutic formulations is centered around data interpretation. This four-part white paper series examines common issues and questions surrounding the principles, measurements and analysis of DLS data and discusses how to minimize the time required for and increase the accuracy of acquiring and interpreting DLS data during the biotherapeutic development process. Here, in Part One of this series, we provide an overview of the key principles of DLS: theory, correlation statistics, deconvolution algorithms, and the intensity to mass transform.Dynamic Light Scattering
Dynamic light scattering (DLS) is a technique which is often used to measure the particle size distribution of bioformulations. DLS has become a staple technology within the areas of bioformulation screening and development, and is routinely used for both monitoring and predicting the colloidal stability of protein formulations.Brownian Diffusion
Brownian motion is defined as the random motion of particles in solution. This motion is a consequence of thermally driven collisions of solvent or dispersant molecules with the particles of interest. The light scattered from a solution of particles diffusing under the influence of Brownian motion will fluctuate with time (Figure 1 - Left). Across long time intervals, the scattering trace appears to be representative of random fluctuations about a mean. When viewed on smaller time scales, however (inset in Figure 1 - Left), it is evident that the intensity trace is in fact not random, but composed of a series of continuous data points. This continuity is a consequence of the physical confinement of particles in positions very close to those they occupied just a short time earlier (Figure 1 - Right). In other words, over short time scales the particles have insufficient time to move very far from their initial positions, and as such, the intensity signals are similar or "correlated".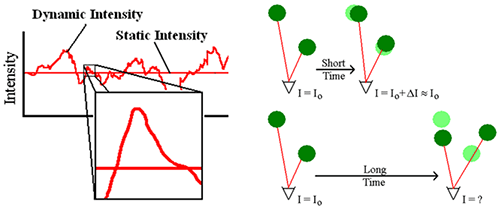
Intensity Correlation
The intensity correlation is a second order statistical technique for measuring the degree of non-randomness in an apparently random data set. When applied to a time-dependent intensity trace, the correlation coefficients (Gτ) are calculated as shown below, where τ is the delay time.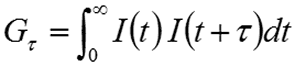
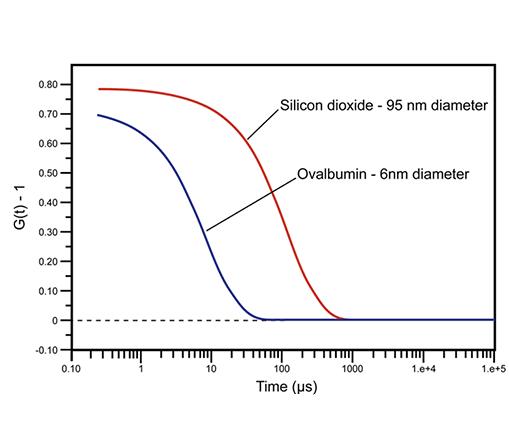
Typically, intensity autocorrelation coefficients are normalized, such that G(∞) = 1. For monochromatic laser light, this normalization imposes an upper correlation limit of 2 for G(τ0) and a lower baseline limit of 1 for G(∞). In practice, the experimental upper limit for DLS autocorrelation is about 1.9. In dynamic light scattering instrumentation, a digital correlator continually adds and multiplies short time scale fluctuations in the measured scattering intensity to generate the correlation curve for the sample. Examples of DLS-measured correlation curves for two solutions of sub-micron particles are given in Figure 2. For the smaller and faster diffusing protein, ovalbumin, the measured correlation curve has decayed to baseline, indicating a complete loss of correlation within 100 µs, while the larger and more slowly diffusing silicon dioxide particle requires nearly 1000 µs before correlation is lost.
Deconvolution (Fitting) Algorithms
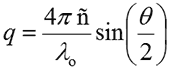
For monodisperse samples consisting of a single particle size group, the correlation curve can be fitted to a single exponential form as given in the following expression, where B is the baseline, A is the amplitude, and D is the diffusion coefficient. The scattering vector (q) is defined by the second expression, where ñ is the solvent refractive index, λ0 is the vacuum wavelength of the laser, and θ is the scattering angle.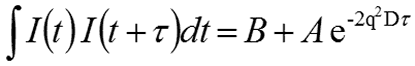
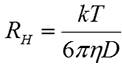
The hydrodynamic radius (RH) is defined as the radius of a hard sphere that diffuses at the same rate as the particle under examination. In DLS, RH is calculated from the measured diffusion coefficient using the Stokes-Einstein equation given below, where k is the Boltzmann constant, T is the temperature, and η is the dispersant viscosity.
A cumulant or single exponential type fit of the correlation curve is the fitting procedure recommended by ISO, the International Standards Organization. The hydrodynamic size extracted using this method is an "intensity" weighted average called the Z average size.
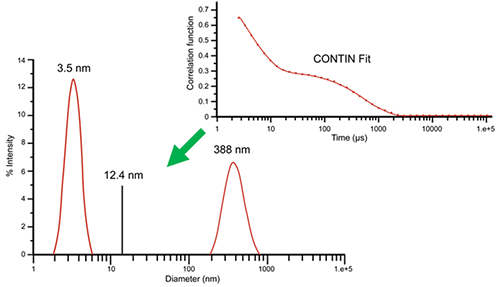
While the cumulant algorithm and Z average are useful for describing general solution characteristics, for multimodal solutions consisting of multiple particle size groups, the Z average can be underwhelming. For these types of samples, multi-exponential fitting algorithms can provide a more complete picture of the particle size distribution. Consider, for example, the correlogram shown in Figure 3 for a 10 mg/mL lysozyme sample in 100 mM NaCl at 69°C. This correlogram clearly exhibits two exponential decays: one for the fast-moving monomer at 3.5 nm and one for the slow-moving aggregate at 388 nm. The size distribution was derived by fitting the measured correlogram to a multi-exponential using the CONTIN algorithm. When the single exponential cumulant algorithm is used, a Z average of 12.4 nm is indicated. As evident here, the Z average, while beneficial for the purposes of citing a single average value, is clearly inadequate for giving a complete description of the distribution results.
>> Download the full Application Note as PDF
Malvern provides the materials and biophysical characterization technology and expertise that enables scientists and engineers to investigate, understand and control the properties of dispersed systems. These systems range from proteins and polymers in solution, particle and nanoparticle suspensions and emulsions, through to sprays and aerosols, industrial bulk powders and high concentration slurries. Used at all stages of research, development and manufacturing, Malvern’s instruments provide critical information that helps accelerate research and product development, enhance and maintain product quality and optimize process efficiency. Our products reflect Malvern’s drive to exploit the latest technological innovations. They are used by both industry and academia, in sectors ranging from pharmaceuticals and biopharmaceuticals to bulk chemicals, cement, plastics and polymers, energy and the environment. Malvern systems are used to measure particle size, particle shape, zeta potential, protein charge, molecular weight, mass, size and conformation, rheological properties and for chemical identification, advancing the understanding of dispersed systems across many different industries and applications. www.malvern.com Material relationships http://www.malvern.com/en/ portal@malvern.com
Newsletters
Receive the latest analytical science news, personalities, education, and career development – weekly to your inbox.