Techniques for the measurement of molecular weight, molecular size and branching.
Introduction
Polymers are ubiquitous throughout industry, in the form of naturally occurring materials, such as cellulose and starch, and synthetic commodities - polystyrene, polyethylene and nylon, for example. As polymer technologies advance, the strength, stability, chemical resistance, and performance modifying properties of these industrially vital materials are meeting increasingly diverse applications. Accurate and precise polymer characterization is essential from R&D through to QC, to ensure that advanced materials meet the exacting performance targets expected of them. The functionality of polymers is defined by their molecular weight (MW), MW distribution, molecular size and structure, the degree of chain branching or cross linking. Effective and efficient methods for measuring these properties are therefore an essential part of the polymer developer’s analytical toolkit. This whitepaper reviews the methods available for measuring the key characteristics of polymers focusing on the benefits and value of gel permeation / size exclusion chromatography (GPC/SEC). Much of the paper talks exclusively about polymers, however many of the principles discussed are equally applicable to proteins or protein conjugate materials.Defining the molecular weight of polymers
A good starting point when looking at methods for polymer characterization is to understand what a polymer is and how this influences the techniques that are suitable for measuring polymer properties, most especially MW. The term polymer derives from the Greek words ‘poly’ and ‘meros’ meaning many parts and it highlights a defining feature of polymeric materials which is their chain like structure. This structure is formed through the development of chemical links between multiple repeating units or monomers. For example, polymerizing styrene (a monomer), under appropriate reaction conditions, produces the polymer polystyrene (see figure 1).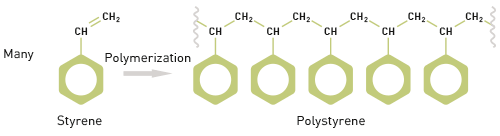
Figure 1: A defining feature of polymers is their chain-like structure, made up of repeating monomers The molecular weight of a polymer therefore relates to that of the monomer and to the number of monomer units in the polymer molecule. Styrene has a molecular weight of 104 Da and so polystyrene has a molecular weight of 104 multiplied by n, the number of styrene molecules in the polymer chain. However, polymer samples rarely contain chains that are all of identical length, rather there is a distribution of chain lengths. This distributive feature of polymers complicates any discussion of MW, necessitating the use of averaged figures, and the associated measurement of distribution. Both the shape of the distribution and average MW affect the properties exhibited by a polymer. Determining MW therefore requires measurement of both the MW of individual chains and the number of chains of any particular weight. Generally speaking, polymer MW exhibits a distribution as shown in figure 2. Using statistical mathematics it is possible to define three different moments for this distribution each of which can be considered as an average MW. The two most commonly used terms are Mn and Mw, the number and weight averaged MW respectively. Mn is the midpoint of the distribution in terms of the number of molecules. Mw, in contrast, describes the midpoint of the distribution on the basis of weight. Mz, the third moment, is a figure more weighted towards higher MWs. The ratio of Mw to Mn is referred to as the polydispersity and is routinely used to describe the width of the distribution.
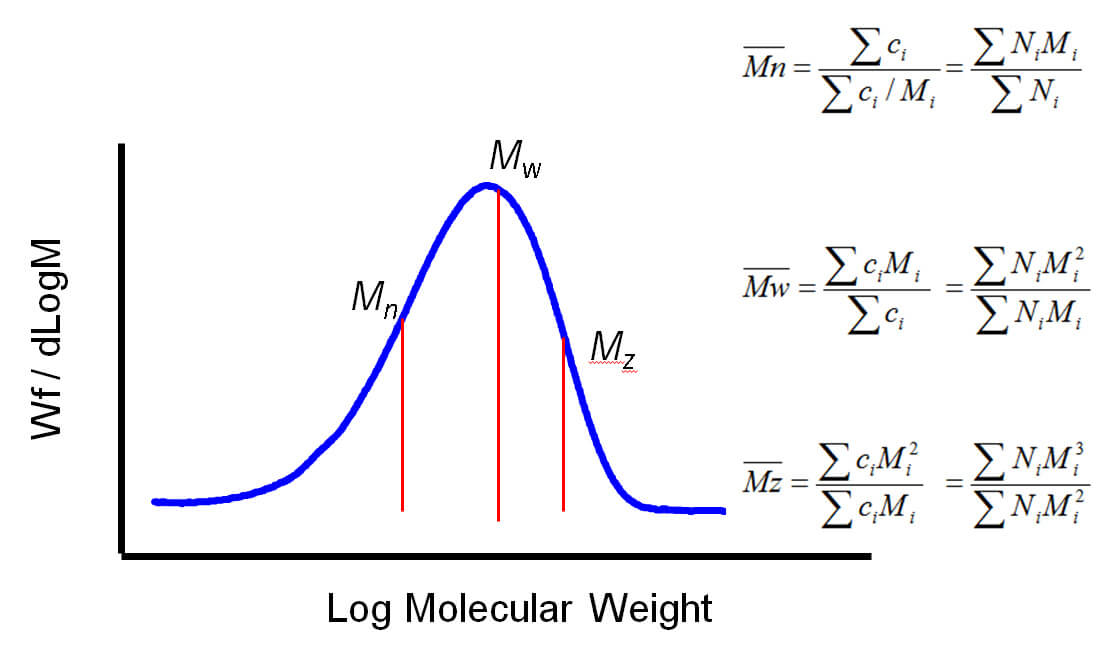
Figure 2: Average MW can be defined in a number of different ways using different moments of the distribution When it comes to measuring MW, the term ‘absolute’ MW is often used. The preceding analysis makes clear that any absolute measurement of MW must also involve the absolute measurement of concentration or number of molecules. This is an important point to consider when assessing alternative techniques for MW measurement.
Measuring MW - introducing static light scattering (SLS)
There are many different techniques that can be used to measure MW including: end group analysis, membrane osmometry, viscometry and light scattering. However, light scattering – and more specifically Static Light Scattering (SLS) – is increasingly the standard approach. For a full description of SLS please refer to the whitepaper ‘Static light scattering for GPC-SEC explained’, see reading list below. Here, we offer a brief description of the principles. When a macromolecule is irradiated by an incident beam of light photons are absorbed and then re-emitted or scattered in all directions. The intensity of the scattered light is proportional to the MW of the polymer, a relationship described by the Rayleigh equation.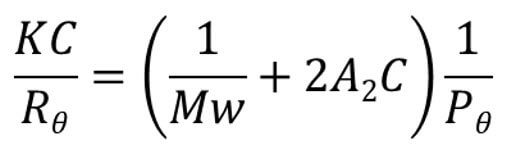
The simplified Rayleigh equation shows how the intensity of scattered light at a given angle, Rɵ is related to weight average molecular weight, Mw. A2 is the second virial coefficient and C is concentration. Pɵ is a complex term that approaches a value of 1 when ɵ is zero. The Rayleigh equation becomes relatively simple to apply when the term Pɵ, which describes the angular dependence of the scatted light, tends to 1. This occurs when ɵ becomes zero i.e. the scattered light is measured at an angle of zero degrees to the incident beam. Unfortunately, measuring at an angle of 0o is not practical as the incident beam intensity dwarves the signal intensity from the scattered light, preventing its determination. Small molecules, less than around 10 – 15 nm radius, scatter light isotropically (Pɵ=1), so intensity measurements are independent of the angle at which the measurement is made. However, larger molecules scatter anisotropically (Pɵ<1), a phenomenon that must be accounted for to access accurate MW for this class of molecules using the Rayleigh equation. Three different approaches to SLS have been developed to address this issue: right angle light scattering (RALS); low angle light scattering (LALS); and multi-angle light scattering (MALS):
- RALS – ignore the error
- LALS – measure close to zero to eliminate the error
- MALS – correct for the error through model fitting
GPC/SEC - a powerful technique for measuring MW distribution
The development of GPC/SEC in the mid 1960s1 brought a powerful new tool to polymer scientists that for the first time enabled detailed study of each part of a polymer distribution. GPC/SEC begins with size fractionation of a sample, followed by detection of each fraction of the sample as it elutes from the separation column (see figure 3). The only drawback with GPC/SEC is that separation is based on the size of the polymer molecules, not on their MW.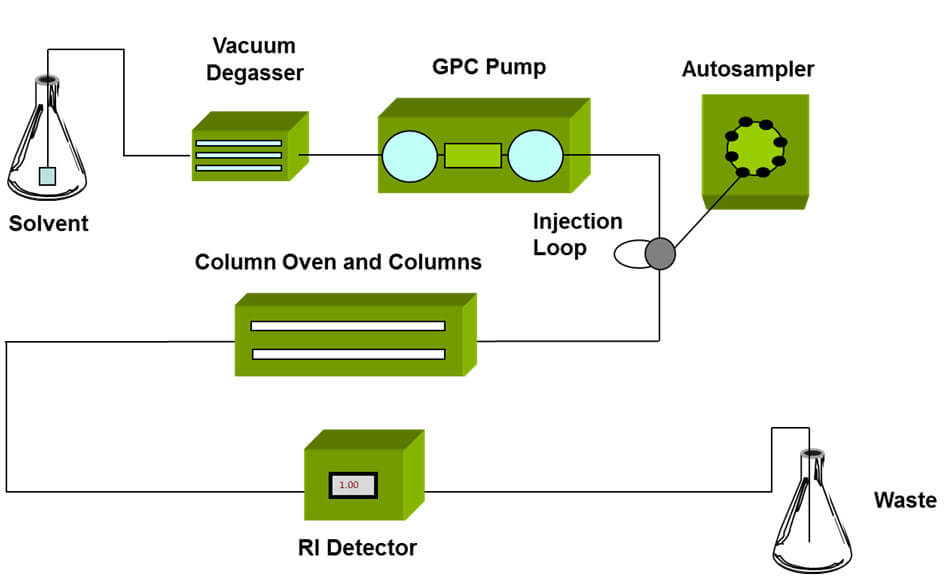
Figure 3: Schematic of a GPC/SEC set-up, detectors are positioned at the exit of the column oven to measure the properties of the eluting sample This limitation can be tackled in a number of different ways, using conventional calibration, universal calibration, or by the addition of a light scattering detector to directly measure MW. In GPC/SEC, the term ‘absolute’ MW is, as a result, now used to differentiate a method that directly measures MW from one that infers it, typically from calibration techniques that are reliant on the use of a set of relevant standards. Light scattering detectors are a useful and convenient tool for measuring MW within a GPC/SEC system set-up. They do not in the strictest sense measure ‘absolute’ MW, since all of the light scattering techniques involve instrument calibration. In addition, MALS detection is dependent on a model fit. However, SLS delivers by far the most accurate data available with existing technology and can be considered ‘absolute’ in the sense of direct measurement. When selecting the best light scattering for any given application it is crucial to closely consider the available options and the strengths and limitations of each light scattering approach. Further guidance on this topic is provided in the webinar ‘Polymer solution characterization – Part 1’ (see further information below for more details).
The importance of molecular size
Molecular size, like MW, is a defining characteristic of most polymers. From a practical perspective the size of a polymer molecule in solution directly influences its rheological behavior which is often directly linked with formulation performance. However, size measurements are equally valued because of the understanding they provide about the conformational changes a polymer undergoes in a specific environment, the extent of solvation and solubility, and any branching in the polymer chain. This insight can be used to establish the structure-function relationships required for successful commercial application. The relationship between molecular size and MW is not constant, different polymers exhibit different molecular densities in solution. The need for size data therefore calls for independent measurement. The size a polymer attains in solution is influenced by the solvent in which the polymer is being handled, its type, temperature and pH, and also by factors that affect the way in which polymer conformation or folding occurs. This behavior is a function of the polarity of the polymer and its structure, most especially any steric effects caused by bulky groups attached to the polymer chain. Most polymer molecules are <100nm so the need for size information calls for techniques with the capability to measure nanoparticles. Three different methods are routinely applied: dynamic light scattering (DLS); MALS; and SLS in combination with intrinsic viscosity (IV) measurement.Measuring molecular size (1) - DLS
In contrast to SLS, DLS measurements derive from the real-time fluctuations in scattered light, rather than the time-averaged data that are the focus with static techniques. For a fuller description of DLS please refer to ‘Dynamic Light Scattering: An Introduction in 30 Minutes’, see reading list below. Here, we offer a brief description of the principles. DLS is most often applied in batch mode. The sample is illuminated by a laser beam, which causes light scattering that is detected by a sensitive photon counting module. By using a correlator, the detected fluctuations in light scattering intensity can be translated into a measure of diffusion speed, thereby providing a value for molecular or particle size. The underlying principle of the technique is that small particles move relatively rapidly under Brownian motion while larger particles move more slowly. The relationship between size and speed of motion is well understood and described by the Stokes-Einstein equation2. The quicker movement of smaller particles is reflected in relatively rapid fluctuations in scattered light intensity while larger particles, conversely, are associated with fluctuations over a longer timescale. Measurements of scattered light intensity therefore enable the determination of particle or molecular size, more specifically hydrodynamic radius (Rh).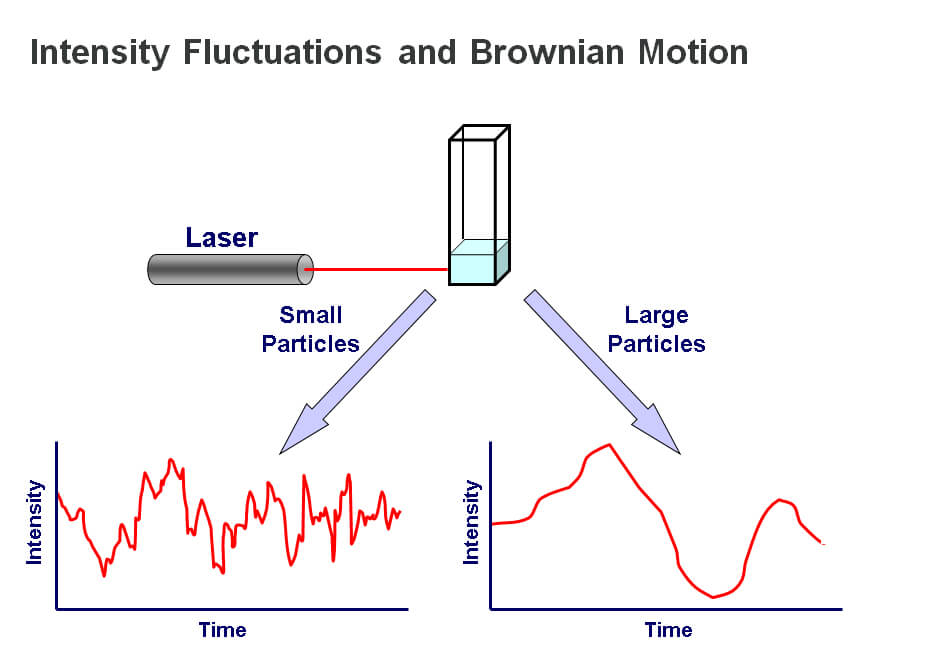
Figure 4: DLS measurements determine particle size from the pattern of intensity fluctuations in scattered light
>> Free download of the full White Paper as PDF
Discover more on:
- Measuring molecular size (2) - MALS
- Measuring molecular size (3) - SLS with IV
- Comparing measures of polymer molecular size
- Investigating molecular structure – the link between size and MW
- Understanding intrinsic viscosity
- Using IV data to investigate structure – introducing the Mark-Houwink plot
Malvern provides the materials and biophysical characterization technology and expertise that enables scientists and engineers to investigate, understand and control the properties of dispersed systems. These systems range from proteins and polymers in solution, particle and nanoparticle suspensions and emulsions, through to sprays and aerosols, industrial bulk powders and high concentration slurries. Used at all stages of research, development and manufacturing, Malvern’s instruments provide critical information that helps accelerate research and product development, enhance and maintain product quality and optimize process efficiency. Our products reflect Malvern’s drive to exploit the latest technological innovations. They are used by both industry and academia, in sectors ranging from pharmaceuticals and biopharmaceuticals to bulk chemicals, cement, plastics and polymers, energy and the environment. Malvern systems are used to measure particle size, particle shape, zeta potential, protein charge, molecular weight, mass, size and conformation, rheological properties and for chemical identification, advancing the understanding of dispersed systems across many different industries and applications. www.malvern.com Material relationships http://www.malvern.com/en/ portal@malvern.com
Newsletters
Receive the latest analytical science news, personalities, education, and career development – weekly to your inbox.

References
- J.C. Moore ‘Gel permeation chromatography – A new method for molecular weight distribution of high polymers’ J. Polym. Sci., Part A-2, 835, (1964) Einstein, A. ‘Investigations on the theory of the Brownian movement’, Fȕrth, R., editor, Cowper, A.D., translator. Methuen, London, 1926, p124 ‘The Dimensions of Chain Molecules Containing Branches and Rings’ J. Chem. Phys. 17, 1301 (1949)