The established technique: Automated imaging
Few approaches to particle characterization are more instantly revealing than automated image analysis. Far faster and less labor-intensive than manual microscopy, automated imaging is extremely useful for applications where particle shape, as well as size, is known to be important. The image acquisition and processing technology that underpin the performance of automated imaging instruments has been transformed in recent decades, such that the technique is now used routinely throughout the product development lifecycle, from R&D through to general QC and manufacturing troubleshooting applications, most especially in the pharmaceutical industry.Modern systems capture, record and analyze images of tens of thousands of individual particles in only a few minutes, enabling statistically significant size and shape distributions to be built up. The selective classification of the particle population on the basis of these morphological properties enables the identification and quantification of discrete populations within a morphologically heterogeneous dispersion. This may indicate the amount of contaminant in a product, for example, or the quantity of active ingredient in a pharmaceutical blend. But not if the particles present are morphologically similar…
The innovation: The addition of Raman spectroscopy.
Adding Raman spectroscopy to automated imaging provides the ability to chemically identify particles within a blend even when they are morphologically similar. The application of Raman chemical classification within the same workflow as automated imaging also offers additional benefits in terms of measurement time compared to traditional Raman mapping techniques. An initial classification based on size and shape parameters enables the Raman measurement to be targeted towards only those particles that need further analysis to determine their identity. Components are identified by comparing their Raman spectra with a reference, enabling component specific size and shape distributions to be generated. This analytical approach, which is known as Morphologically Directed Raman Spectroscopy (MDRS), delivers powerful ‘detective’ capabilities that are already finding application in forensic investigations and in pharmaceutical development, as the following case study illustrates.The reveal: What’s in your flu remedy?
Two commercially available powder-based flu remedies, one an innovator product, the other a generic, were analyzed using MDRS to compare and contrast their ingredients. The particle size distributions for the two formulations, shown overlaid in Figure 1, highlight clear differences between the two products. Of the two, the innovator product has more particles in the 20 -100 micron region while the generic alternative contains a higher proportion of larger particles. The question is – will these differences affect the delivery of the active within each formulation?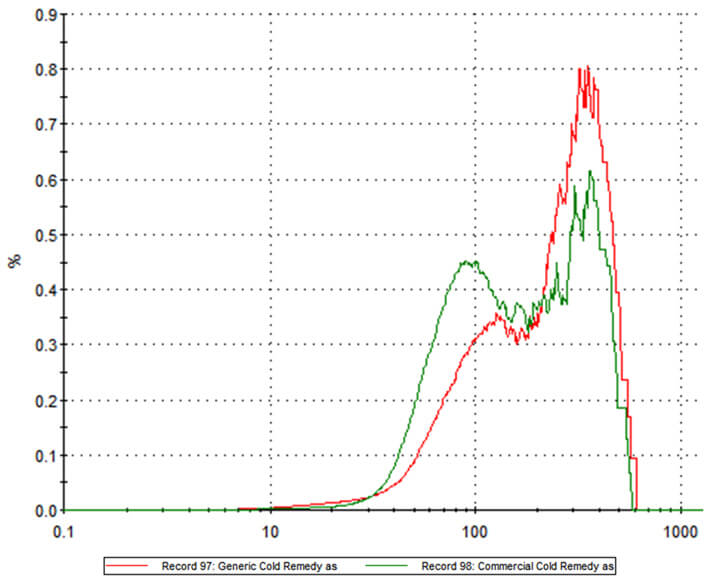
Figure 1: Particle size distribution data for branded and generic powder based flu remedies reveal substantial differences between the two products.
Raman spectroscopy was used to identify the different chemical components within the two formulations (see Figure 2) and to more clearly interpret the particle size information.
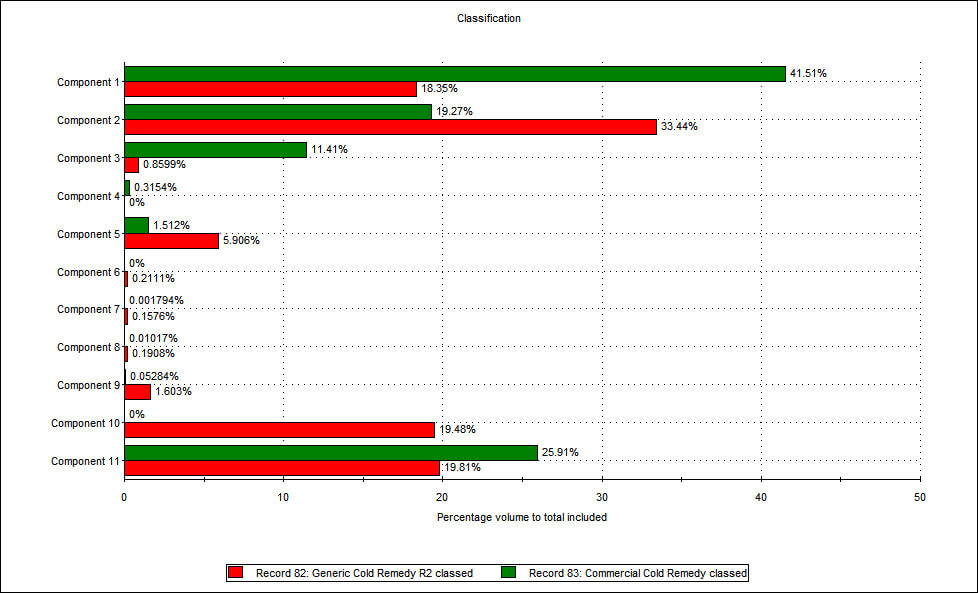
Figure 2: The application of Raman spectroscopy enables a comparison of the relative proportions of different components within branded and generic flu remedies. The components that represent the biggest percentage by volume in both products are components 1, 2 and 11. Using a spectral library database and a process of structural elucidation, component 1 was identified as a type of sucrose while component 2 was identified as one of the active ingredients - paracetamol. These data therefore suggest that the generic contains more of the active ingredient than the branded remedy, a somewhat unexpected result! Further analysis was carried out to assess whether there were any differences in the physical characteristics of the paracetamol in each sample. Figure 3 shows the particle size distribution for the paracetamol alone, from both formulations. This was generated by including only data relating to particles that were classified as being component 2, on the basis of spectroscopic data.
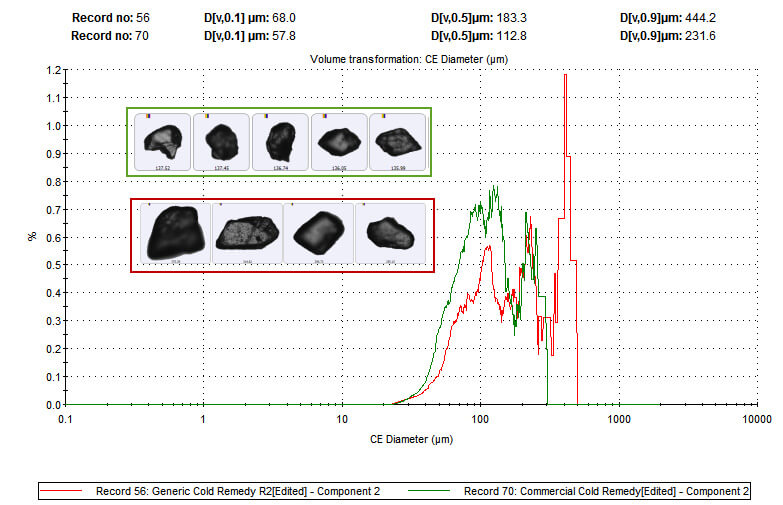
Figure 3: Particle size distribution data for the paracetamol (component 2) present in both flu remedies reveals that the branded product contains finer paracetamol particles than the generic.
These data indicate that the branded product contains finer paracetamol particles than the generic. As both flu remedies must be dissolved before administration, this difference in particle size may directly impact clinical efficacy by altering the dissolution rate of the active ingredient. Here then MDRS reveals that although the branded product contains less of the active ingredient it may deliver speedier relief.
Malvern provides the materials and biophysical characterization technology and expertise that enables scientists and engineers to investigate, understand and control the properties of dispersed systems. These systems range from proteins and polymers in solution, particle and nanoparticle suspensions and emulsions, through to sprays and aerosols, industrial bulk powders and high concentration slurries. Used at all stages of research, development and manufacturing, Malvern’s instruments provide critical information that helps accelerate research and product development, enhance and maintain product quality and optimize process efficiency. Our products reflect Malvern’s drive to exploit the latest technological innovations. They are used by both industry and academia, in sectors ranging from pharmaceuticals and biopharmaceuticals to bulk chemicals, cement, plastics and polymers, energy and the environment. Malvern systems are used to measure particle size, particle shape, zeta potential, protein charge, molecular weight, mass, size and conformation, rheological properties and for chemical identification, advancing the understanding of dispersed systems across many different industries and applications. www.malvern.com Material relationships http://www.malvern.com/en/
Newsletters
Receive the latest analytical science news, personalities, education, and career development – weekly to your inbox.


