In recent years at the Research Institute for Chromatography (RIC), we have noted a remarkable shift in analytical development projects from the pharmaceutical industry. Ten years ago, requests were mainly related to small molecule synthetic drugs, such as the blockbuster atorvastatin (trade name Lipitor from Pfizer) with a formula of C33H35FN2O2 and a molar mass of 559 g/mol. However, today’s demands often involve large recombinantly expressed protein biopharmaceuticals, such as monoclonal antibodies (mAbs) – exemplified by trastuzumab (trade name Herceptin from Roche/Genentech), a highly heterogenous product with a formula of C6560H10132N1728O2090S44 and molar mass 148,057 g/mol for one of its main variants! A big shift indeed.
Fiona Greer, Life Sciences Global Director, Biopharma Services Development at SGS, shares her analytical journey through the biotechnology boom.
How did you get into analytical science?
At school I was always into medicine. I initially wanted to be a surgeon but had second thoughts. I knew I wanted to be involved in science though, and was extremely interested in microbiology, so I went to university to do a degree in Food Science and Microbiology. That was back in the late 1970s – at the start of the biotechnology industry and the use of microbial fermentation. At that point, I got sidetracked into analytical chemistry by an Masters in forensic science, before becoming very interested in analytics and doing a PhD at Aberdeen University in Protein Chemistry. Many years ago, a Bulgarian diplomat was killed with ricin from the castor oil plant. I worked with a similar toxin, a lectin from the kidney bean plant (which is not as potent as ricin; it was very interesting to isolate this toxin and look at its capabilities. I think it was this investigative nature of analytical chemistry that piqued my interest.What was your route into mass spectrometry?
My PhD was spent between Aberdeen University and the Rowett Institute for Nutrition and Health, where they had one of the first gas phase sequencing instruments – a piece of kit that was revolutionizing protein sequencing at the time. Around the same time, Professor Howard Morris, FRS – professor of biochemistry at Imperial College London – was setting up a company (M-Scan) to use mass spectrometry to sequence proteins – pioneering work. I joined Howard’s company in 1984, where we initially used an ionization technique called fast atom bombardment (FAB) to sequence a variety of proteins and glycoproteins from the new biotechnology industry. That was my first foray into applying analytical instrumentation to biotech problems.Sounds like an exciting field...
It was! But actually, protein science was not very trendy at that point – everybody wanted to be a geneticist or molecular biologist. Up until that time – and even during that time – a lot of the scientific focus had been on genetics, working on constructs that could express proteins. It wasn’t until they’d succeeded in engineering and process development that they needed protein science to confirm that the product was the right one. To begin with, we were a small operation, about five or six people in the UK. But by 2010, we had four international sites operating with about 65 people. We had a reputation as the foremost protein and carbohydrate structural lab offering analytical services. At that stage, all four labs were acquired by SGS.Is staying at the cutting edge important to you?
Very much so. In the beginning, we were a very small privately funded company; we had to keep driving forward so we could offer new techniques and capabilities to survive. And it wasn’t just about running the instrumentation – determining the analytical strategies and interpreting the data were also crucial to solving problems. It’s actually a considerable time since I wore a white coat in the lab, but with SGS I’m still focused on pushing forward our capabilities in the laboratories – ensuring that we keep introducing the most up-to-date, properly qualified and validated techniques.What has kept you in the same company for so long?
The interest and excitement. The field has developed rapidly – driven by the challenges we were given by the biotechnology industry. When I first started, we were using a state-of-the-art high-field magnet mass spectrometer made by VG – now Waters – and the largest intact molecule it could look at was probably 6–7,000 Daltons. We had to drive forward both the instrumentation and the ionization techniques to be able to look at intact proteins at high sensitivity and perform MS/MS sequencing. We picked up electrospray very quickly along with MALDI-TOF and Q-TOF instrumentation. Biotechnology is a global industry and I have worked around the world, interacting with a lot of very bright scientists who were setting up companies, trying to exploit their research and bring it through into a commercial product.Why do you think you’ve had such a successful journey?
Sheer bloody-mindedness! Everybody makes their own choices, and maybe I was lucky in that I chose something that I enjoy doing. I get intellectual stimulation from working with very bright people, and it’s scientifically rewarding to look at the new techniques that are coming through and to try and introduce them to the labs that I work with.This shift at RIC from small to large also has consequences for the titles and content of our contributions at International Symposia – and this short communication (requested by the editors of The Analytical Scientist) is based on two recent presentations, namely at ISCC 2016 in Riva del Garda, Italy (by Pat Sandra) and at HPLC 2016 in San Francisco, USA (by Koen Sandra). Many of you will know that mAbs have emerged as important therapeutics for the treatment of life-threatening diseases, such as cancer and autoimmune diseases. Today, more than 40 mAbs are marketed in the United States and Europe, of which 18 display blockbuster status. Over 50 are in late stage clinical development. mAbs are currently considered the fastest growing class of therapeutics, with sales more than doubling since 2008. In other words, the analytical challenge is not going away. From a structural point of view, mAbs are large tetrameric immunoglobulin G molecules of approximately 1,300 amino acids, forming Y-shape structures composed of four polypeptide chains that are two identical heavy chains (Hc) of ca. 50 kDa and two identical light chains (Lc) of ca. 25 kDa. The chains are connected through several disulfide bounds that can chemically be reduced to give the Hc and Lc fragments (see further). All mAbs have two N-glycosylation sites in the crystallizable fragment (Fc) that are occupied by specific glycan structures.
Substantial heterogeneity, subtle differences
During expression, purification and storage, a variety of modifications (chemical or enzymatic) can take place providing a macromolecule with a substantial heterogeneity. With several mAb blockbusters open to the market or soon evolving out of patent, the biosimilar market has exploded in recent years. Often subtle differences between originators and biosimilars must be revealed and addressed. The size, complexity and heterogeneity of mAbs requires a large toolbox of techniques for a detailed characterization and comparability assessment. The portfolio of analytical techniques presently applied in these studies embraces all contemporary separation (liquid chromatography and capillary electrophoresis) and mass spectrometric techniques. Concerning liquid chromatography (LC), nearly all modes developed over the years are used; affinity chromatography (AC), ion exchange chromatography (IEX), size exclusion chromatography (SEC), hydrophobic interaction chromatography (HIC), hydrophilic interaction liquid chromatography (HILIC) and reversed phase liquid chromatography (RPLC). All of them provide specific information in helping to unravel the complexity of mAbs (1, 2). Since the beginning of the 21st century, tremendous improvements have been made in LC column technology (for example, sub-2 µm porous and superficially porous particles) and instrumentation (pressure of 1000 bar and higher). These developments are commonly exploited and very successfully applied in one-dimensional (1D) LC format for mAb analysis in combination with mass spectrometers that offer accurate mass, high resolution, MS/MS and ion mobility capabilities at very high sensitivities. Notwithstanding this, the higher the chromatographic resolution or peak capacity at the front-end, the better the data in terms of content and sensitivity. On-line two-dimensional (2D) LC represents an elegant way to increase peak capacity (3). In on-line 2D-LC, individual peaks, certain parts or the whole chromatogram are subjected to two different separation mechanisms. On-line 2D-LC can be divided into two main types. In comprehensive two-dimensional LC (LC×LC), the whole stream of effluent of the first (1D) column is transferred to the second (2D) column. In heart-cutting LC (LC-LC), one peak or one part of the chromatogram is transferred to the second column. Multiple peaks or multiple parts of the chromatogram can also be selected for transfer to the second column (mLC-LC). Multiple heart-cutting LC (mCEX-RPLC) combined with high resolution MS has recently been used to identify the main isoforms of the mAb rituximab (4) and to characterize the antibody drug conjugate (ADC) ado-trastuzumab emtansine (Kadcyla) (5). In our recently presented lectures, the emphasis was mainly on LC×LC of the tryptic digests of mAbs and ADCs (5, 6). Indeed, analysis of the peptides provides detailed information in amino acid sequence and modifications and is an excellent way of elucidating where modifications (for example, deamidation, oxidation, isomerization, conjugation, mutation) are taking place. In contemporary LC×LC, the target is to combine completely different separation modes, for example, IEX×RPLC, HILIC×RPLC. However, for tryptic digest characterization, we prefer the combination RPLC×RPLC. High orthogonality (optimum occupancy of the 2D-space) is obtained by running both dimensions at a different pH, resulting in a different charge on the peptides. Note that in the above combinations, RPLC is always used in the second dimension. Why? Because of the commercial availability of high quality “fast” RPLC second dimension columns and their compatibility with MS.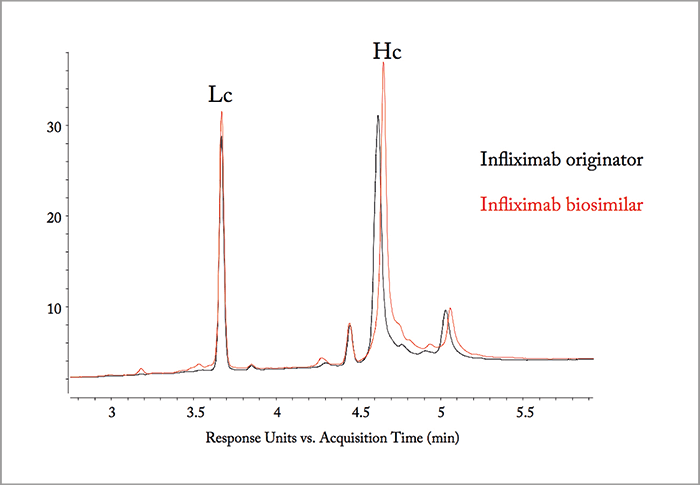
Mapping mAbs
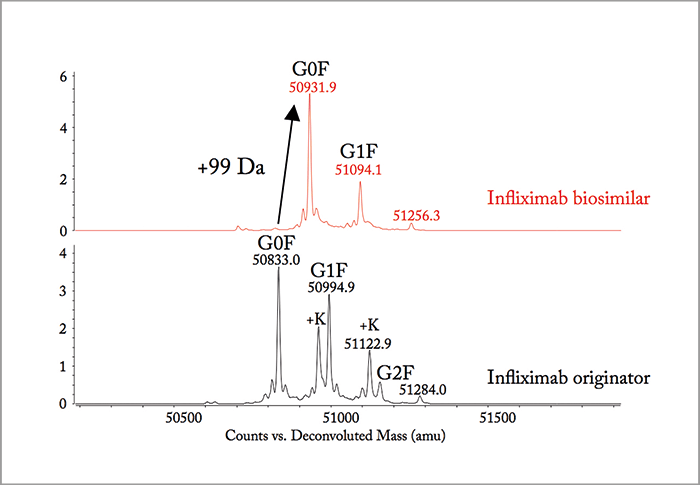
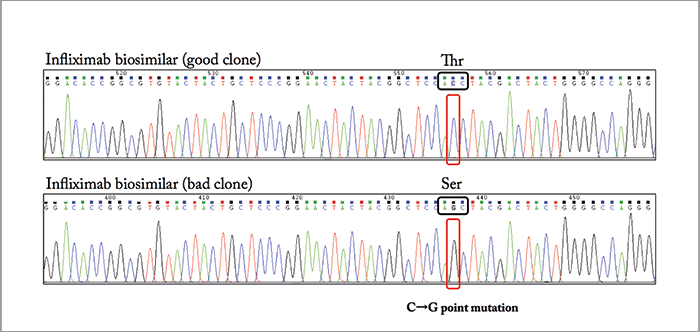
To illustrate the attractiveness of 2D-LC for detailed characterization and comparability assessment of biopharmaceuticals, we describe the comparison of the tryptic digest of the originator infliximab (trade name Remicade from Johnson & Johnson) and a biosimilar candidate, for which, apparently, the recombinant expression in Chinese hamster ovary (CHO) cells was going wrong. Note that infliximab produced by Celltrion and commercialized as Remsina (Celltrion) or Inflectra (Hospira) is the first mAb biosimilar approved by the European Medicines Agency (EMA). The Food and Drug Administration (FDA) very recently approved Inflectra (Pfizer) for commercialization in the US. Figure 1a compares the LC analysis of the infliximab originator and the candidate biosimilar after chemical reduction to cleave the disulfide bridges. The Lc fraction is identical but a retention shift is noted for the Hc fraction. The m/z difference in the Hc fractions is 99 Da (m/z 50,833.0 in the originator and 50,931.9 in the biosimilar) as illustrated in Figure 1b. RPLC×RPLC peptide mapping was subsequently performed to elucidate the origin of this shift and Figure 2 compares the relevant part of the 2D plot. Both plots are very similar but some striking differences are noted when also taking the MS data into consideration. The spots SLSLSPG and SLSLSPGK clearly present in the originator are replaced by one spot – SLSLSPGI – in the biosimilar, which according to the mass spectral data corresponds to the addition of an isoleucine (I) to SLSLSPG or the replacement of lysine by isoleucine in SLSLSPGK at the C-termini. From a biochemical point of view, this makes sense and results in a positive move of 113 Da. The origin of the two spots SLSLSPG and SLSLSPGK in the originator mAb can be explained by the knowledge that heavy chains are historically cloned with a C-terminal lysine, but during cell culture production, host cell carboxypeptidases act on the antibody, resulting in the partial removal of these lysine residues. A very small retention shift was also noted in another spot that has been identified by MS/MS as NYYGSTYDYWGQGTTLTVSSASTK in the originator and as NYYGSSYDYWGQGTTLTVSSASTK in the biosimilar. The change from T (threonine) to S (serine) is -14 Da. If we combine both modifications (+113 Da and - 14 Da), we find a difference of +99 Da! Therefore, two point mutations are at the origin of this wrong recombinant expression, namely ACC to AGC (T to S) and AAA to AUA (K to I). This was confirmed with reverse transcription polymerase chain reaction (RT-PCR) and DNA sequencing (illustrated in Figure 3) for a CHO clone that was producing a biosimilar candidate with the good sequence and another with the wrong sequence.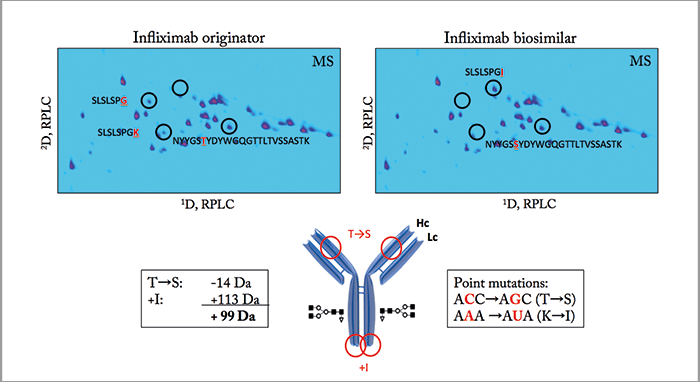
An important point is the present ruggedness of LC×LC and 2D-LC in general. The fact that major instrument manufacturers entered the 2D-LC market and made robust instrumentation available is an important asset for its breakthrough and applicability. Biologics are driving demand for reliable analytical techniques, not only in R&D but also in QA/QC. Our experience in LC×LC is such that we consider RPLC×RPLC ready to be implemented in routine environments.
Pat Sandra is President and Koen Sandra is Scientific Director at the Research Institute for Chromatography, Belgium. They would like to acknowledge coworkers Gerd Vanhoenacker, Isabel Vandenheede and Mieke Steenbeke for their contributions to the 2D-LC work and biopharmaceutical characterization.
For newcomers to the field of 2D-LC or for colleagues needing more information on the principles, practical implementation and applications, they refer readers to “Two-dimensional Liquid Chromatography” by Peter W. Carr and Dwight R. Stoll (7).
References
- K Sandra et al, “Modern chromatographic and mass spectrometric techniques for protein biopharmaceutical characterization”, J. Chromatogr. A 1335, 81-103 (2014). S Fekete et al, “Chromatographic, electrophoretic and mass spectrometric methods for the analytical characterization of protein biopharmaceuticals”, Anal. Chem. 88, 480-507 (2016). K Sandra and P Sandra, “The opportunities of 2D-LC in the analysis of monoclonal antibodies”, Bioanalysis 7, 2843-2847 (2015). DR Stoll et al, “Direct identification of rituximab main isoforms and subunit analysis by online selective comprehensive two-dimensional liquid chromatography–mass spectrometry”, Anal. Chem. 87, 8307-8315 (2015). K Sandra et al, Vanhoenacker G, Vandenheede I, Steenbeke M, Joseph M, Sandra P. “Multiple heart-cutting and comprehensive two-dimensional liquid chromatography hyphenated to mass spectrometry for the characterization of the antibody-drug conjugate ado-trastuzumab emtansine”, J. Chromatogr. B doi: 10.1016/j.jchromb.2016.04.040. G Vanhoenacker et al, “Comprehensive two-dimensional liquid chromatography of therapeutic monoclonal antibody digests”, Anal. Bioanal. Chem. 407, 355-366 (2015). PW Carr & DR Stoll, “Two-Dimensional Liquid Chromatography”, Primer, Agilent Technologies, 5991-2359EN (2015).


