This four-part series examines common issues and questions surrounding the principles, measurements and analysis of DLS data and discusses how to minimize the time required for and increase the accuracy of acquiring and interpreting DLS data during the biotherapeutic development process. In Part Four, we address frequently asked questions related to the application of DLS to the characterization of protein therapeutic formulations.
A Malvern Instruments' Bioscience Development Initiative
Executive Summary
Dynamic light scattering (DLS) is an analytical technique used to measure the particle size distribution of protein formulations across the oligomer and sub-micron size ranges of approximately 1 nm to 1 µm. The popularity of DLS within the biopharmaceutical industry is a consequence of its wide working size and extended sample concentration ranges, as well as its low volume requirements. With that said, the challenge that remains with the application of DLS to protein therapeutic formulations is centered around data interpretation. In this four-part white paper series, common issues and questions surrounding the principles, measurements and analysis of DLS data are discussed in order to help minimize the time required for and complexity of acquiring and interpreting DLS data that is critical throughout the development process. In this fourth white paper of the series, we address frequently asked questions related to the application of DLS to the characterization of protein therapeutic formulations.Dynamic Light Scattering
Dynamic light scattering (DLS) is an analytical technique used within bioapplications to measure particle size distributions across the oligomer and sub-micron size ranges. In a DLS measurement, scattering intensity fluctuations are correlated across small time spans, yielding a distribution of diffusion coefficients, which is subsequently converted into an intensity weighted particle size distribution using the Stokes-Einstein equation. Over the past few decades, DLS has transitioned from an esoteric academic R&D tool into a mainstream technology routinely used for purposes such as protein aggregate screening and bioformulation stability & stress testing. This transition has not been absent of challenges, particularly in the area of data interpretation, and as the technology is introduced into more and more new application areas, the importance of recognizing the limitations of DLS cannot be overstated. This document addresses frequently asked questions regarding DLS data interpretation, including:- What is the precision of a DLS measurement?
- What is the accuracy of a DLS measurement?
- What is the resolution of a DLS measurement?
- What is the minimum sample concentration for DLS?
- What is the maximum sample concentration for DLS?
- Is it better to use longer run times?
- What is the effect of fluorescence on DLS measurements?
- What is the effect of scattering angle on DLS results?
- How accurate is the DLS volume distribution?
- What is the hydrodynamic radius?
- Can the molecular weight be measured with DLS?
Figure 1 shows a comparison of various DLS-derived intensity and volume based parameters for repeat measurements of a 300 nm latex standard in a Malvern Zetasizer Nano ZS system, with the values in parentheses being the relative standard deviation of the 15 measurements. As noted in these results, the Z average size derived from DLS has a precision of better than 1%.
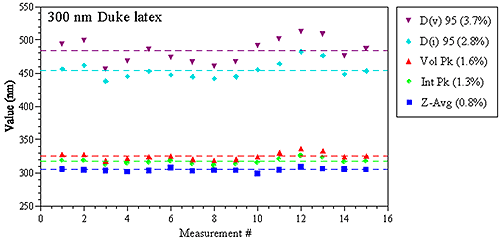
Figure 1: Replicate DLS measurement results for a 300 nm latex size standard
What is the accuracy of a DLS measurement?
The Z average size derived from a DLS measurement is the intensity-weighted hydrodynamic size of a particle. As implied by the definition, the Z average is influenced by hydration or solvation effects. Transmission electron microscopy (TEM), the technique generally used to confirm the size of latex standards, produces a number-weighted average size of a dehydrated hard sphere. Despite the subtle differences in the measured parameters, accuracy in DLS measurements is often quoted in relation to TEM-validated latex sizing standards.Figure 2 shows a comparison of the TEM and hydrodynamic sizes measured for a series of NIST-traceable latex sizing standards, along with the relative differences between the two values. As noted in this figure, the difference is always < 5% and generally < 2-3%, with the DLS value always being a little larger, due to the hydration effects discussed above.
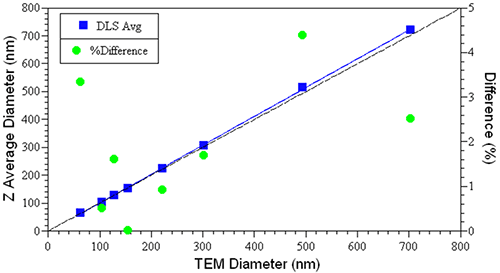
Figure 2: Comparison of DLS- and TEM-measured sizes for a series of NIST-traceable latex sizing standards
What is the resolution of a DLS measurement?
In DLS, the particle size distribution is derived from a measurement of the Brownian motion of an ensemble collection of particles. Deconvolution of the measured correlogram is considered an ill-posed problem, in that small amounts of noise can significantly influence the resulting particle size distribution. DLS therefore, is considered a low resolution technique.
The theoretical limit for DLS baseline resolution of a mixture of components is 1.7x difference in particle size. In practice, this limit is found to be about double the theoretical value, or to be roughly 3x difference in size. So while one could easily resolve a mixture of 10 nm and 30 nm latex spheres, a mixture of 10 nm, 20 nm, & 30 nm latexes would appear as a very broad distribution in a DLS measurement. From the standpoint of resolving oligomeric protein mixtures, the 3x size limit translates to about 12x difference in molecular weight. So in the absence of physical separation via an SEC-type technique, protein oligomeric distributions cannot be resolved by DLS.
Figure 3 shows a comparison of the DLS distributions measured for a mixture of BSA oligomers in batch and flow modes. The SEC-separated measurement shows three principal components, with diameters of ~ 6.4 nm, 10.0 nm, & 11.5 nm, corresponding to the monomer, dimer, and trimer, while the batch measurement shows a broad distribution, with a mean of about 9 nm. With that said, for samples consisting of a single particle family, the typical %Pd or %polydispersity is around 15%, where %Pd is defined as the relative standard deviation of the peak (= σ / Mean). This rule of thumb value is routinely used to distinguish peaks composed of multiple components from those containing a single family of particles. So while DLS cannot resolve oligomeric components, the width of the measured distribution can provide qualitative information regarding the oligomeric composition of a sample.
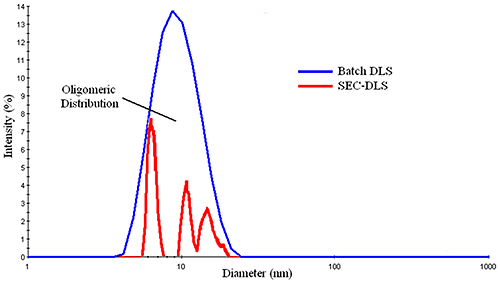
Figure 3: Comparison of batch and SEC-separated DLS measurements of a mixture of BSA oligomers
What is the minimum sample concentration for DLS?
The minimum required sample concentration for DLS measurements is dependent upon a number of instrumental and sample properties. Instrumental properties include the size of the scattering volume, the laser power and wavelength, the scattering angle, and the sensitivity of the detector - all of which can influence the intensity or magnitude of the scattering signal. Sample properties include the analyte's molecular weight and partial specific volume. The noise in the correlation curve varies as the inverse square root of the total number of analyte-scattered photons counted during the sample time (Jakeman, Pike, & Swain, Journal of Physics A 1971, V4, 517-534). In order to achieve an acceptable signal-to-noise ratio for a DLS measurement, at least 1 million residual photons should be counted during the timeframe of the measurement, where residual = sample - solvent. The analyte's scattering intensity varies with its molecular weight. As such, the minimum required sample concentration to achieve the 1 million photon limit decreases with increasing molecular weight. In other words, the minimum sample concentration for larger particles is lower than that for smaller particles. The partial specific volume of the particle will also influence the scattering intensity. Globular or compact molecules scatter much more strongly than expanded or random coil type molecules of identical molecular weight. So the minimum sample concentration for a fixed optical configuration and particle molecular weight is lower for globular molecules, compared to random coil molecules. While the million residual photons approach defined by Jakeman et al. is satisfactory as far as signal-to-noise is concerned, one must also consider the limits defined by the geometry of the system. In dynamic light scattering, the number of particles observed during the course of the measurement must be constant. As the concentration is decreased, the probability of maintaining a constant number concentration diminishes. Eventually, the numbers will fluctuate, resulting in erroneous results. Number fluctuations are generally easy to spot in DLS measurements, and are often manifested as elevated baselines in the measured correlogram (Figure 4).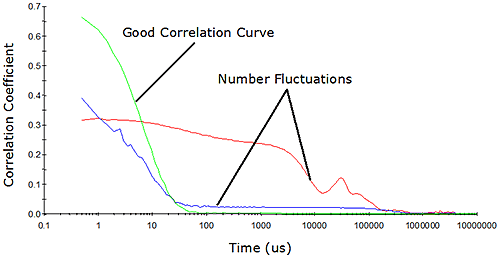
Figure 4: Example correlograms showing number fluctuation effects Number fluctuations are particularly problematic with DLS instruments utilizing focused optics to increase sensitivity. In order to produce a high power density in the scattering volume, the laser and detector optics in these types of systems are focused to narrow diameters. While this increases the system's sensitivity to sample concentration, the smaller scattering volume also increases the likelihood of number fluctuations if larger particles are present (Figure 5). As a consequence of the smaller scattering volume, the upper size limit for measurements with these systems is significantly lower than that of non-focused optical systems.
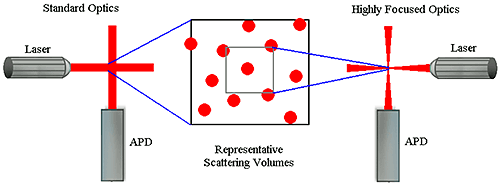
Figure 5: Example correlograms showing number fluctuation effects Figure 6 shows the hydrodynamic size (and molecular weight) dependence of the minimum required sample concentration for DLS measurements of globular protein samples, with the Zetasizer Nano ZS and ZS90 systems. Notice the V shape of the data. For small particles (left leg of V), the minimum concentration limits are controlled by the signal-to-noise ratio, while the limits for larger particles (right leg of V) are controlled by number fluctuations.
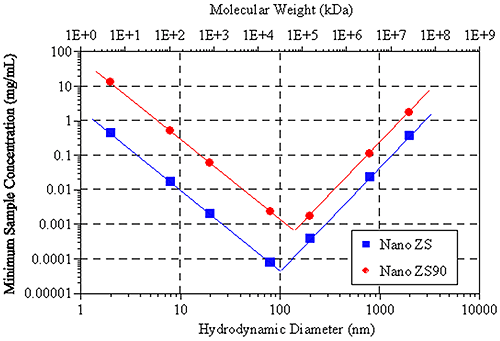
Figure 6: Size dependence of the DLS minimum sample concentration for globular particles using the Zetasizer Nano ZS & ZS90 systems When considering number fluctuations, a typical follow up question is whether it is necessary to filter samples prior to measurement. The answer to that question depends upon the angle of measurement for the DLS system and the information one is attempting to gather from the measurement. Factors that can lead to number fluctuations include the presence of trace amounts of dust or large sample particles, or low sample concentrations. The latter is a factor that can only be addressed by increasing the sample concentration. With regard to dust and large sample particles, such as sub-micron or even sub-visible particles, spinning the sample in a benchtop centrifuge for about 20 minutes will often remove the particles generating the number fluctuation problem. Consider Figure 7 for example, which shows a comparison of the measured correlograms and particle size distributions for a dust-contaminated protein sample measured neat, after filtration using a 0.45 µm filter, and after centrifugation for 10 minutes at 3000 rpm in a benchtop microcentrifuge. As evident in this figure, the number fluctuation caused by the presence of dust is completely removed in both the filtered and centrifuged samples. The removal of the dust is confirmed in the size distribution results, which show no indication of any particles larger than the primary particle family at circa 6 μm. Note, however, that the removal of the dust also has very little effect on this primary particle size peak. In other words, the size measured for the primary particle is the same, whether the sample is filtered, centrifuged, or measured neat.
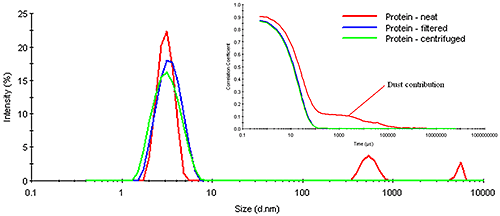
Figure 7: DLS results for a dust-contaminated protein sample measured neat, after filtration, and after centrifugation, using a Zetasizer Nano ZS The question of whether or not one needs to filter samples prior to measurement also depends upon the detection angle. Large particles scatter more strongly in the forward direction. Modern DLS systems utilize backscatter optics. In the backscatter mode, the scattering from large particles is strongly attenuated in comparison to the forward scattering angles. As such, the presence of dust is less catastrophic when measured with a backscatter configuration, as opposed to the traditional 90 degree optical configuration. In fact, the quality of the signal from the smaller particle family in Figure 7 is a direct consequence of the dust's attenuating effect on the backscatter optical configuration in the Zetasizer Nano ZS. >> Download the full Application Note as PDF
Malvern provides the materials and biophysical characterization technology and expertise that enables scientists and engineers to investigate, understand and control the properties of dispersed systems. These systems range from proteins and polymers in solution, particle and nanoparticle suspensions and emulsions, through to sprays and aerosols, industrial bulk powders and high concentration slurries. Used at all stages of research, development and manufacturing, Malvern’s instruments provide critical information that helps accelerate research and product development, enhance and maintain product quality and optimize process efficiency. Our products reflect Malvern’s drive to exploit the latest technological innovations. They are used by both industry and academia, in sectors ranging from pharmaceuticals and biopharmaceuticals to bulk chemicals, cement, plastics and polymers, energy and the environment. Malvern systems are used to measure particle size, particle shape, zeta potential, protein charge, molecular weight, mass, size and conformation, rheological properties and for chemical identification, advancing the understanding of dispersed systems across many different industries and applications. www.malvern.com Material relationships http://www.malvern.com/en/ portal@malvern.com
Newsletters
Receive the latest analytical science news, personalities, education, and career development – weekly to your inbox.