Conexiant
Login
  • The Analytical Scientist
  • The Cannabis Scientist
  • The Medicine Maker
  • The Ophthalmologist
  • The Pathologist
  • The Traditional Scientist
The Analytical Scientist
  • Explore

    Explore

    • Latest
    • News & Research
    • Trends & Challenges
    • Keynote Interviews
    • Opinion & Personal Narratives
    • Product Profiles
    • App Notes

    Featured Topics

    • Mass Spectrometry
    • Chromatography
    • Spectroscopy

    Issues

    • Latest Issue
    • Archive
  • Topics

    Techniques & Tools

    • Mass Spectrometry
    • Chromatography
    • Spectroscopy
    • Microscopy
    • Sensors
    • Data & AI

    • View All Topics

    Applications & Fields

    • Clinical
    • Environmental
    • Food, Beverage & Agriculture
    • Pharma & Biopharma
    • Omics
    • Forensics
  • People & Profiles

    People & Profiles

    • Power List
    • Voices in the Community
    • Sitting Down With
    • Authors & Contributors
  • Business & Education

    Business & Education

    • Innovation
    • Business & Entrepreneurship
    • Career Pathways
  • Events
    • Live Events
    • Webinars
  • Multimedia
    • Video
Subscribe
Subscribe

False

The Analytical Scientist / Issues / 2018 / May / Purge and Trap of Soft Drink - Ethanol Found
Food, Beverage & Agriculture Chromatography Gas Chromatography

Purge and Trap of Soft Drink - Ethanol Found

A non-alcoholic beverage is tested by the most sensitive purge and trap method.

05/02/2018 1 min read

Share

It’s no coincidence that the human nose is directly over the mouth, nor that there is an “aromatic” class of organic compounds. While smell is not strictly speaking a component of taste, it certainly can have a significant effect. On the quantitative analytical testing side, the Purge and Trap method can extract and concentrate volatile flavor compounds from a liquid sample for subsequent analysis by GC/MS. In this application, a soft drink was tested with purge and trap-GC/MS on a CDS 7000C purge and trap concentrator coupled to PAL RTC 850 System. The results reveal some interesting findings.

Figure 1. Most significant peaks from a soft drink sample shown in the purge and trap-GC/MS chromatogram.
Figure 2. More detailed peak profile in the purge and trap-GC/MS chromatogram.

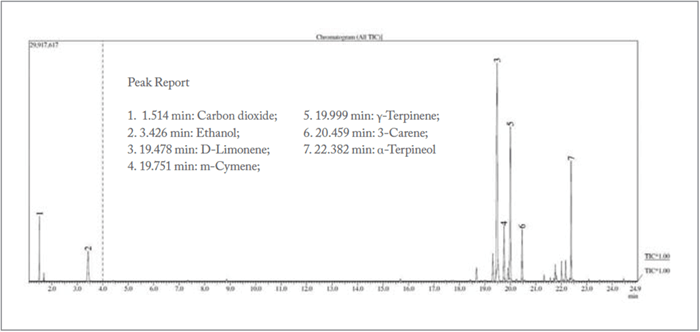
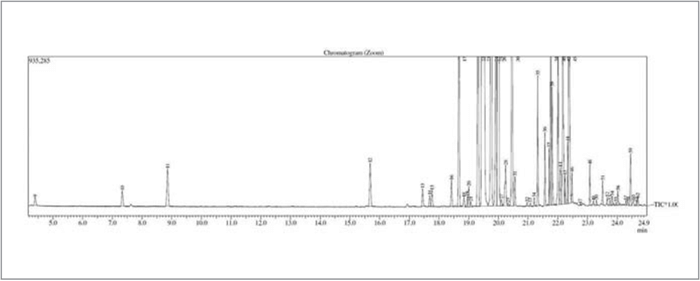
Figure 1 tagged the seven most significant peaks from a soft drink sample. Of particular interest was that ethanol was found at sub hundred ppb level.  Typically, beverage manufacturers’ recipes and formulations are trade secrets.  Based on general industry knowledge and analytical experience it is highly unlikely that ethanol is added as a formulary compound.  Since the sample contained sugar, low-level ethanol is hypothesized to be the result of fermentation. Ethanol is among the compound list, supporting findings by previous researchers and of concern to consumers, although at a very low level. Figure 2 depicts a more detailed look, with more than sixty compounds identified in the purge and trap-GC/MS chromatogram. The data presented here is a simple capability demonstration.  As a routine practice, quantitative P&T-GC/MS is performed in EPA Methods 525 and 8260 for aqueous samples.  Potential applications for ethanol content include process monitoring/optimization and comparative sample analysis for diet beverages. Contact: Carol Byrd  +1 610 932 3636
Download the full application note: tas.txp.to/0518/CDS 

Newsletters

Receive the latest analytical science news, personalities, education, and career development – weekly to your inbox.

Newsletter Signup Image

False

Advertisement

Recommended

False

False

The Analytical Scientist
Subscribe

About

  • About Us
  • Work at Conexiant Europe
  • Terms and Conditions
  • Privacy Policy
  • Advertise With Us
  • Contact Us

Copyright © 2025 Texere Publishing Limited (trading as Conexiant), with registered number 08113419 whose registered office is at Booths No. 1, Booths Park, Chelford Road, Knutsford, England, WA16 8GS.