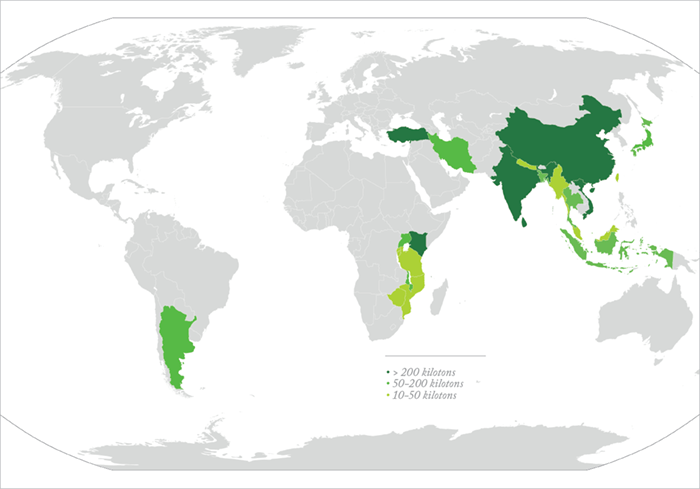
The primary motivation of our group is to explore the complex interactions that occur between human and natural systems – including environmental contamination, pesticides and petroleum products. Recently, we have used tea as a model system to learn how small and extreme changes in climate affect plant chemistry. Studies to date have mainly focused on yield, with very limited attention given to impact of climate variability on flavor, aroma and functional quality. Tea is an ideal crop system for climate or variability studies since it’s harvested several times throughout the year. Tea is also an economically significant crop, with 6 million tons produced in 2017 – worth $39 billion. How and why may tea quality become vulnerable to changing climate conditions? And what would be the impact on consumer purchasing decisions, markets, farmer livelihoods, ecological knowledge and management practices? The objective of our research team – which consists of graduate students, postdocs, and faculty from Tufts University, Montana State University and University of Florida – is to provide quantitative data to answer these questions.
Teatime tech
Tea is a complex sample containing thousands of compounds. To investigate natural system interactions, we knew we needed to analyze hundreds of samples both in the field and in the lab. We also knew we needed to track the changes in plant metabolites over several years. Our challenge was to find analytical tools that were up to the task.
First we looked at sampling, and investigated static and dynamic headspace, SPME, and others, before settling on stir bar sorptive extraction. By placing a small, inexpensive magnet on one side of the leaf and a Twister on the other, we can collect dozens of samples from many locations in the same day to investigate plant–climate and/or plant–herbivore interactions. By using the same sampling technology to sample brewed tea, we can compare direct-sampling leaf, unprocessed “environmental” and “processed” green tea infusions.
GC/MS is universally used to analyze the volatile fraction of tea. Most investigators focus on just 50–100 compounds; in contrast, we study the total metabolome using advanced automated, sequential 2D GC/MS. In the past, GC-GC/MS has been used to identify specific compounds of interest by transferring small fractions of the sample from the first to the second column, but because of long runtimes and data analysis times, GC-GC/MS is not routinely used to identify all components in a complex sample. For example, if one-minute sample portions are analyzed and the separation time on each column is one hour, it will take four days to analyze one sample. Analysis of the fortieth sample portion requires 41 minutes on the first column and 60 minutes on the second column, as well as equilibration time before the 41st sample portion can be analyzed. Despite the long analysis time, we have shown that a wax (first column) peak that appears to be the product of a single high concentration analyte can actually mask (due to coelution) as many as 25 compounds on a DB-5 (second column) stationary phase. The same is true when the columns are reversed. Such detailed metabolomic profiling necessitated the development of new data analysis software to automate the library-building process.
Data day
Our Ion Analytics software (sold by Gerstel, Germany) automatically inspects each peak to ensure that the mass spectrum at each peak scan is constant. If so, the software annotates the database by importing the compound’s retention time, mass spectrum, 3–5 ions and relative abundances, identity and CAS number, if available. Sample-specific information such as sample identifiers, sensory or nutraceutical properties can also be added to the database. If not, the software identifies 3–5 constant peak spectra, averages them, and then subtracts the spectrum from the total ion current signal at each peak scan. If two compounds coelute, the software inputs the information above into the database. If compound information cannot be assigned, a numerical identifier is applied. If more than two compounds coelute, the process continues until the residual signal approximates background noise.
Initially, we developed the software to do target analysis of pollutants in the field. Because the sample matrix was typically crude oil, petroleum or coal tar, I developed spectral deconvolution software to quantify target compounds in the presence of concentrated matrixes.
Ion Analytics software differs from other spectral deconvolution software because it eliminates additive ion effects from coeluting compounds, which makes concentration measurements accurate. The deconvolution software is used in the metabolomic library-building process, along with MS subtraction algorithms, to process the data files produced by GC-GC/MS analyses.
We have already demonstrated the accuracy of the software when analyzing EPA-targeted pollutants by GC×GC/MS, and work is now in progress to assess if the software offers advantages when GC×GC/MS is used to produce detailed metabolomic profiles. Current software is inefficient, so most investigators use non-targeted analysis to discern differences in samples, but these software platforms bin ions, which often result in thousands of molecular features. It’s common for researchers presenting at conferences to begin by stating the number of features, then quickly move on to discuss the 20–30 compounds they use to present results. In our work we use compounds (based on their clean spectra) to discern differences.
High tea?
It is well known that the quality of tea is affected by climate. For example, tea from Yunnan Province, China, experiences extreme rainfall effects due to the onset of the East Asian monsoon rains between spring (a few mm) and summer (hundreds of mm). Consumers know that tea harvested from Yunnan Province in the summer is poor in quality, with buyers paying $0.10 on the $ compared to spring tea. What we didn’t know, however, was how much the tea metabolome changed. That was a question we were able to answer – our research revealed that more than half of the ~400 volatile tea metabolites changed in concentration with heavy rainfall; some concentrations are 100 to 1000-times higher in spring tea, others much higher in summer tea. These striking differences in concentration include compounds that impact on the taste and/or health properties of the tea.
Yunnan also served as an ideal location to test temperature effects – plants grown in the same farm on the same mountain can differ in elevation by up to 1000 m – we produced the first quantitative data documenting how volatile plant metabolite concentrations differ with temperature. We showed that a 5 °C difference in temperature between plants grown at 600 and 1500 m yielded striking differences in metabolites, with concentrations of some compounds increasing or decreasing by hundreds of percent. High elevation tea has a sweeter, more floral taste compared to low elevation tea, which tastes grassy and barnyard-like. We discovered that low elevation tea contained most of the health beneficial compounds found in high elevation tea, but high elevation tea contained nutraceuticals not found in low elevation tea.
Finally, we studied the effects of monsoon season on total phenolics and antioxidant potential. We learned that catechin (antioxidants and polyphenolics) concentrations decreased significantly within the first ten days of the heavy rains, but that total phenolics and antioxidant potential increased. Once the summer rains fell heavily, however, the plant seems to adjust to this stress factor, since catechin concentrations differed little between seasons.
Clearly, climate conditions have a dramatic impact on the chemistry of tea. Soon we will submit our findings from Yunnan and Fujian in China for publication. But previous studies on tea grown in South Carolina suggest that location has most impact, followed by rainfall and then temperature.
In Yunnan, the Tea Research Institute is already harvesting tea from plants that consumers dislike and extracting health beneficial compounds for commercial application. This offers the farmer an opportunity to obtain a higher price and/or sell leaves for medicinal purposes.
Beyond tea
The software we developed can be applied to any GC/MS (including GC-GC/MS and GC×GC/MS) analysis. Outside of the realms of tea, we at TUSSC are interested in helping cancer patients who have experienced changes in their ability to smell and taste, which often results in patients losing interest in eating and suffering from malnutrition. According to the Academy of Nutrition and Dietetics, current recommendations for patients suffering from altered sense of smell and taste is insufficient. Using a sensory-directed chemical approach, we plan on investigating what cancer patients with compromised sensory abilities can and cannot smell, and what they like and dislike. Our highly trained sensory panel will work with cancer patients, culinary chefs and nutritionists to identify plant-based foods they both like and will eat. We will then analyze the foods using the techniques described above, and olfactometry, to identify the relevant flavors and odors.
The same approach could be used to assess authenticity and purity of raw ingredients and final products, especially if sensory-active compounds lead to brand quality and equity. The emerging cannabis market would certainly benefit from this type of analysis, especially as it relates to product purity and potency.
This project is funded by the National Science Foundation, Grant BCS-131375.
Newsletters
Receive the latest analytical science news, personalities, education, and career development – weekly to your inbox.