Introduction
Medical grade poly methyl methacrylate (PMMA) has been used over many years for a variety of medical applications such as artificial joints, dentures, bone cement and fillers for cosmetic purposes. One of the main, and oldest, usages is for intraocular lenses to treat cataracts, with medical grade PMMA used to correct vision since the late 1940's. For this application, the polymer must be of high purity with no significant traces of residual monomer. Indeed the monomer used to make PMMA, methyl methacrylate (MMA), is a possible carcinogen so it is especially important that medical grade PMMA be totally free of the potentially harmful monomer. Furthermore for medical use, the PMMA must be free of other organic contaminants. To that end, new methods of polymer sterilization are being explored. This application note investigates ultra high molecular weight PMMA (UHMW-PMMA) and the effect of irradiation at doses typically used for sterilization. The absolute molecular weight and molecular weight distribution of the gamma-sterilized PMMA were compared to the unsterilized UHMW-PMMA using triple detection GPC/SEC. In conjunction with the light scattering detector, the viscometer was used to study the structure of the polymer before and after irradiation, through the Mark-Houwink plot.
Experimental
Size exclusion chromatography (SEC), also referred to as gel permeation chromatography (GPC), is an analytical technique that separates macromolecules based on their hydrodynamic volume or size. Conventional GPC systems compare the elution volume to known standards to estimate the molecular weight of the sample by assuming the same molecular weight to size ratio for the standard and the unknown polymer. By contrast, triple detection measures the molecular weight directly using light scattering and a concentration detector such as the RI detector. The molecular weight measured is said to be absolute as it comes directly from the low angle light scattering (LALS) detector and the columns do not need to be calibrated. The molecular weight of the sample is measured independently of the elution volume. Triple detection also uses a viscometer to measure the intrinsic viscosity of the eluting sample. From the intrinsic viscosity and the molecular weight, the Mark-Houwink plot can be constructed, giving information about the structure of the polymer, including the branching, In essence, triple detection GPC/SEC allows the analysis of a sample's molecular weight distribution, molecular size distribution as well as the structure change across the distribution. Understanding these properties enables important conclusions to be made regarding the sample's bulk performance and processability. The PMMA samples were kindly provided by the Materials Research Group at Kingston University, London. The first sample is a UHMW-PMMA while the second sample is the same PMMA that has undergone gamma-sterilization. Both samples were dissolved in THF for 5 days and were then filtered using a 1.0 µm pore size PTFE filter prior to injection. The analysis was performed on a Viscotek TDAmax GPC system. The signals from the differential refractometer (RI), right angle light scattering (RALS), low angle light scattering detector (LALS) and differential viscometer detector are reported. Each sample was injected twice at a volume of 100 μL and chromatographed in THF at 1.0 mL/min using three ViscoGEL organic columns in series. The whole system, including columns, detectors and interdetector tubing was maintained at a constant temperature of 35°C. The interdetector volumes, band broadening and instruments constants were determined using a narrow polystyrene standard. The value of dn/dc used for the PMMA samples in these measurements was 0.089 mL/g.Results
Figure 1 shows the raw signals from triple detection of the PMMA samples. The untreated UHMW elutes around 21 mL as seen in figure 1a while the gamma sterilized sample elutes, in the same conditions, around 26 mL, figure 1b. Since the separation in the columns is based on the hydrodynamic radius, this shows that the irradiated sample has a lower molecular size, probably indicating a lower molecular weight.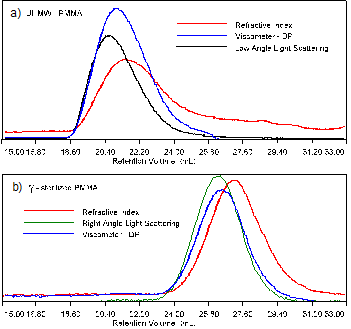
Figure 1: Triple detection chromatograms of the samples. a) for the ultra-high molecular weight PMMA sample and b) for the gamma-sterilized PMMA Although the raw data shown in figure 1 has been adjusted for the inter-detector delay volume, the traces of the refractometer, the viscometer and the low angle light scattering detectors are not peaking at the same elution volume. This is due to the fact that the detectors are measuring different, but complementary molecular parameters. The refractometer signal (RI) is proportional to the concentration while the LALS detector has a signal proportional to both the concentration and the molecular weight. The fact that both are not peaking at the same elution volume indicates that the sample has significant polydispersity. The viscometer signal is proportional to both the viscosity and the concentration, so the peak position will be different to those from both the RI and light scattering signals. In table 1 the results calculated from the triple detector system are given for two injections of both PMMA samples. The weight average molecular weight, Mw, for the UHMW-PMMA sample is more than 5 million g/mol or Daltons (Da). The sterilized PMMA exhibits a much lower Mw of 320,000 Da. The OmniSEC software used to calculate the molecular weight also gives the different moments of the molecular weight distribution of the sample. It does this by taking the instantaneous molecular weight Mi for each slice along with the instantaneous concentration, ci. The number average molecular weight (Mn), which is the first moment of the distribution, is used together with the Mw, to give the polydispersity (Mw/Mn) for the sample. The UHMW-PMMA has a moderate polydispersity. The sterilized sample has a higher polydispersity resulting from the polymer degradation, a conclusion that was not obvious by just looking at the width of the peaks. The peak width is a function of the resolution power of the columns, as well as the real polymer molecular weight distribution, and there may not be a completely linear calibration curve, particularly at the extremities of the column separation range. Table 1: Results calculated by OmniSEC for the 2 repeats of the 2 PMMA samples
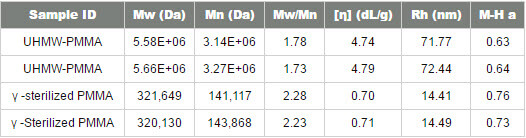
Table 1 also presents the average intrinsic viscosity ([η]), of the solution in dL/g. The UHMW-PMMA has a much higher viscosity than the sterilized one, as expected from the molecular weight difference. Figure 2 shows the normalized distribution of both PMMA samples. The y-axis is the weight fraction over the differential logarithm of the molecular weight. It is obvious by looking at this graph that statically all the PMMA has degraded but no structural information can be inferred from this graph alone.
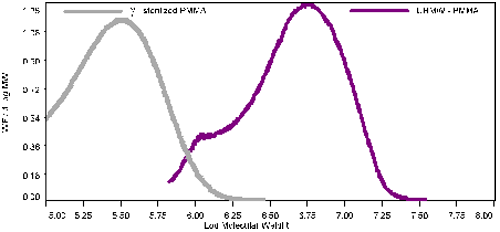
Figure 2: Normalized weight fraction vs. log M. of the samples Figure 3 shows the Mark-Houwink plot for the two PMMA samples. The y-axis is the intrinsic viscosity on a log scale. The intrinsic viscosity was measured directly from the differential viscometer for each slice of elution volume. The x-axis is the absolute molecular weight measured by the light scattering detector. For the UHMW sample there is clearly two slopes corresponding to the main peak of the sample and the shoulder at lower molecular weight. The shoulder is on the left part of the graph with a range roughly of 5.8 to 6.4 in log molecular weight units. This section has a larger slope than the section with a higher molecular weight. The slope is the Mark-Houwink a value. For the lower molecular weight part of the UHMW-PMMA, the value of the exponent a (MH-a) is 0.8, indicating a linear structure of PMMA. The higher molecular weight section, above log 6.4 has a slope, MH-a, of 0.5, indicating a branched polymer. The irradiated polymer in figure 3 shows a similar curvature, but not enough statistical information is available for the lower molecular weight fraction to calculate accurately the MH-a value in this section. For the higher molecular weight part, above log 5.0, or 10 000 Da, the MH-a value is 0.7. This value is much higher than the 0.5 for the UHMW-PMMA indicating that the cleaving action from the gamma rays targeted preferentially the branching points on the polymer chain reducing the long chain branching in the sample.
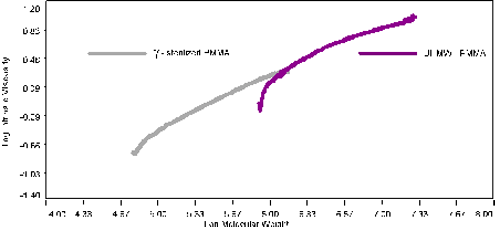
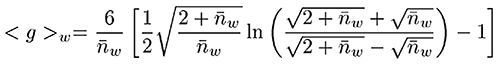
Figure 3: Mark-Houwink plot of the samples The Zimm-Stockmayer expression for this type of polymer is given below, where nw is the branching number.
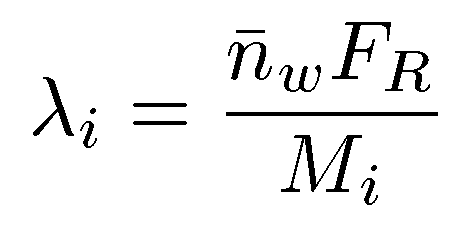
The branching frequency (λ), can then be determined from the expression shown below, where Mi is the mass for each chromatographic slice and FR is the repeat factor, defined as the mass of a number of repeat units.
By applying the Zimm-Stockmayer branching calculations and by using literature Mark-Houwink values for linear PMMA in THF, the number of branches in the material was estimated. This is shown as the cyan line (left-hand y-axis) in figure 4 and estimates the number of branches to be an average of almost 5 per molecule and reaching as high as 13 branches per molecule at the highest molecular weights.
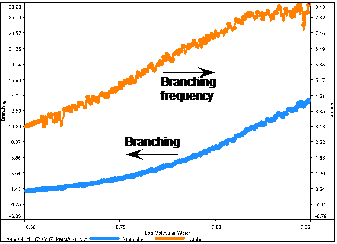
Figure 4: Branching summary
The calculation is then taken further and the branching is normalized to the molecular weight. An average branching frequency of almost 4 branches per 100,000 MMA units (orange line, right-hand y-axis) is observed. Then the frequency increases to up to 8 branches per 100,000 MMA units at higher molecular weight.
Conclusion
Ultra High Molecular Weight PMMA was successfully analyzed using advanced triple detection GPC and the comparison with the γ -sterilized PMMA reveals that the latter has a much lower molecular weight compared with the untreated PMMA, indicating a polymer cleaving action by the radiation. The viscometer allowed us to draw the conclusion that the polymer structure also was affected, the gamma rays cleaving the polymer, probably at the branching points. So, although gamma sterilization is a known method used to make products useable for medical application, in the case of PMMA care should be taken as the final product is a degraded polymer with lower molecular weight and a different structure.
Malvern provides the materials and biophysical characterization technology and expertise that enables scientists and engineers to investigate, understand and control the properties of dispersed systems. These systems range from proteins and polymers in solution, particle and nanoparticle suspensions and emulsions, through to sprays and aerosols, industrial bulk powders and high concentration slurries. Used at all stages of research, development and manufacturing, Malvern’s instruments provide critical information that helps accelerate research and product development, enhance and maintain product quality and optimize process efficiency. Our products reflect Malvern’s drive to exploit the latest technological innovations. They are used by both industry and academia, in sectors ranging from pharmaceuticals and biopharmaceuticals to bulk chemicals, cement, plastics and polymers, energy and the environment. Malvern systems are used to measure particle size, particle shape, zeta potential, protein charge, molecular weight, mass, size and conformation, rheological properties and for chemical identification, advancing the understanding of dispersed systems across many different industries and applications. www.malvern.com Material relationships http://www.malvern.com/en/ portal@malvern.com
Newsletters
Receive the latest analytical science news, personalities, education, and career development – weekly to your inbox.

References
- CM Pratt et al, Polymer Degradation and Stability 91 (2006) 2315-2317 BH Zimm and WH Stockmayer, J. Chem. Phys. 17 (1949) 1301-1314 YJ Chen et al, Polymer Bulletin, 30 (1993) 575-578