Introduction
Whether you are isolating novel proteins for the first time, investigating the aggregation behavior of purified proteins in different conditions or evaluating the success of your conjugation; ultimately, you have one thing in common: mixtures! And it is in these situations that you will inevitably be reaching for your chromatography columns. Here, we demonstrate how, in the time taken to run a single chromatogram, significant insights into the composition of sample mixtures can be gained from multi-detection size exclusion chromatography (SEC). Multi-detection SEC combines column chromatography with viscometer, refractive index (RI), ultra violet (UV) and light scattering detectors to provide a powerful analytical tool that can be incorporated simply and effectively into the workflow of those interested in the analysis of protein mixtures. In this application note, we describe the analysis of a semi-purified protein mixture containing β-amylase (Figure 1). Step-by-step, we show how different properties of the proteins elicit a specific response in each detector and how the coupling this data can be qualitatively and quantitatively evaluated.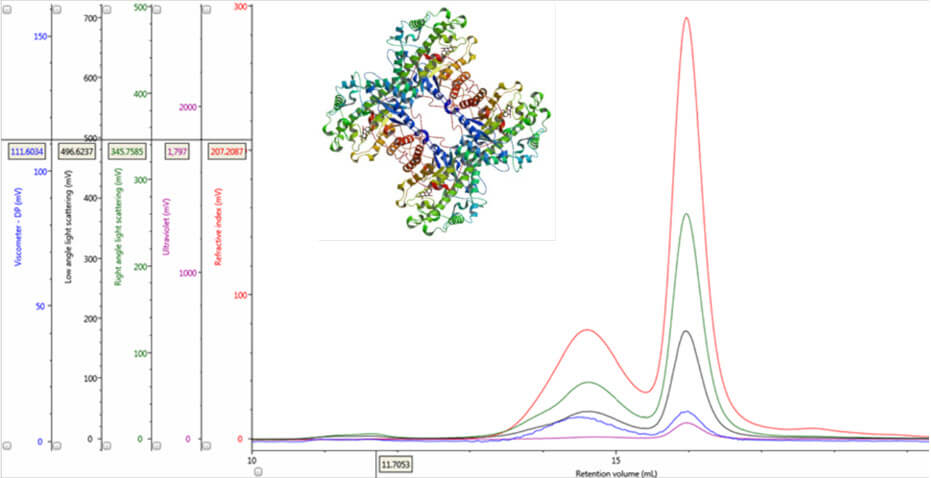
Figure 1: Multi-detector chromatograms of β-amylase from sweet potato (Main); Crystal structure of β-amylase from sweet potato (inset, PDB ID:1fa2)
Materials and methods
A semi-purified mixture containing β-amylase from sweet potato (Sigma Aldrich, UK) was solubilized in phosphate buffered saline (pH 7.4) at a concentration of approximately 2 mg/mL and then filtered (cellulose acetate membrane, 0.2 µm). Chromatographic separation of protein mixtures was achieved at a flow rate of 1 mL/min using analytical size exclusion columns (2 x Viscotek P3000, Malvern, UK) and phosphate buffered saline as the mobile phase. Samples, columns and detectors were maintained at 25°C throughout data acquisition. Aliquots of 100 µL were applied onto the columns using the zero waste injection mode. All measurements were performed on a complete OMNISEC system comprising the OMNISEC REVEAL detector module and OMNISEC RESOLVE separations module.Results and discussion
Interpretation of deconstructed multi-detection data Data obtained from multi-detection SEC holds a wealth of information. Each detector responds to specific properties of the eluting protein molecules and the combination of these responses can be thought of as a fingerprint that is unique and characteristic for each and every protein under analysis. Below we show how these fingerprints can be discerned from a visual assessment of the raw chromatograms and how computational processing of the data support these conclusions.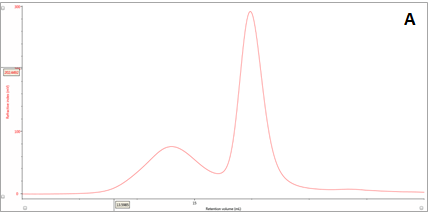
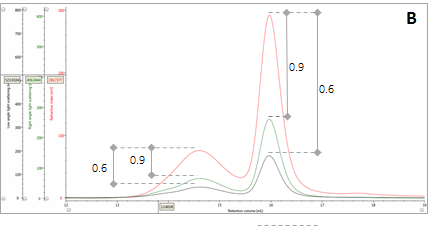
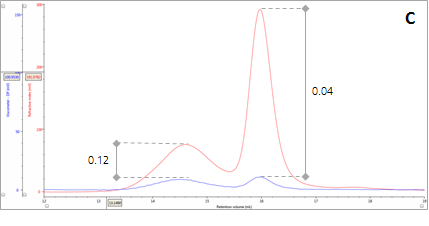
Figure 2: Multi-detector chromatograms: (A) RI response (red), (B) Overlay of RI (red) and light scattering responses (green and black), (C) Overlay of RI (red) and Viscometer responses (blue), (D) Overlay of RI (red) and UV (purple) responses. The peaks in Panels B-D have been annotated with the ratios of RALS to RI, LALS to RI, Viscometer to RI and RI to UV, respectively.
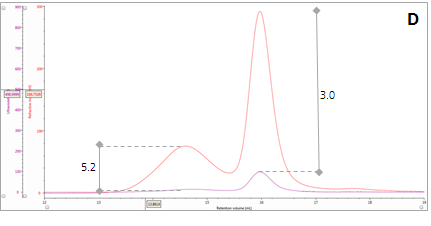
RI detection
In traditional chromatography the RI detector is used to trace the elution of the sample components through the column. Panel A in Figure 2 shows the RI elution profile of the β-amylase mixture. Here, two main peaks with respective retention volumes (VR) of 14.60 mL (Peak 1) and 15.97 mL (Peak 2) can be clearly discerned. From size exclusion principles, we can deduce that the hydrodynamic properties of the two species are different with the molecules eluting first being of larger hydrodynamic size.Combination of RI and light scattering signals
The coupling of a concentration detector with static light scattering detectors allows the determination of molecular weight through the Rayleigh equation. However, a simpler calculation can be applied to raw chromatograms to compare the apparent molecular weight of two different peaks. Simplifying the Rayleigh equation, we can state that the apparent molecular weight of molecules in a peak is proportional to the ratio of light scattering signal to the concentration (LS/C). When applying this to the signals in multi-detection chromatograms, this means that if two proteinaceous peaks have the same LS/C ratio then they must have the same apparent molecular weight. The converse is true for proteinaceous peaks with different LS/C ratios. Figure 2 (Panel B) shows an overlay of RI and light scattering signals. Interestingly, both peaks have the same RALS/C and LALS/C ratios: 0.9 and 0.6, respectively. Therefore, when one considers the simplified Rayleigh assumption, this means that the protein molecules of both populations in this sample have the same apparent molecular weight.Combination of RI detection and viscometry
There are two conditions that could explain how this sample could produce chromatograms with peaks of the same molecular weight but temporally distinct VR. The first is that the sample comprises two structurally different species of β-amylase with different hydrodynamic sizes. Alternatively, the sample may comprise two different proteins with the same molecular weight but, again, with different hydrodynamic sizes. An evaluation of the ratio of Viscometer Differential Pressure (DP) and concentration responses (VDP/C) can be used to confirm that these assumptions are validated by the data and are not just artefacts of run conditions or column degradation e.g. voids. Taking the VDP/C ratio from the apex of the peaks (Figure 2, Panel C) gives an approximate intrinsic viscosity value (IV). For this sample, IV for peaks 1 and 2 are 0.12 and 0.04, respectively. Since higher IVs correspond with more open structures, earlier elution for Peak 1 can be rationalized with a larger hydrodynamic size and supports the conclusions drawn thus far. >> Download the full Application Note as PDFMalvern provides the materials and biophysical characterization technology and expertise that enables scientists and engineers to investigate, understand and control the properties of dispersed systems. These systems range from proteins and polymers in solution, particle and nanoparticle suspensions and emulsions, through to sprays and aerosols, industrial bulk powders and high concentration slurries. Used at all stages of research, development and manufacturing, Malvern’s instruments provide critical information that helps accelerate research and product development, enhance and maintain product quality and optimize process efficiency. Our products reflect Malvern’s drive to exploit the latest technological innovations. They are used by both industry and academia, in sectors ranging from pharmaceuticals and biopharmaceuticals to bulk chemicals, cement, plastics and polymers, energy and the environment. Malvern systems are used to measure particle size, particle shape, zeta potential, protein charge, molecular weight, mass, size and conformation, rheological properties and for chemical identification, advancing the understanding of dispersed systems across many different industries and applications. www.malvern.com Material relationships http://www.malvern.com/en/ portal@malvern.com
Newsletters
Receive the latest analytical science news, personalities, education, and career development – weekly to your inbox.


