Reliable identification and quantification of components present at ‘undetectable’ levels in extremely complex matrices without laborious sample preparation protocols – and without breaking the bank.
No doubt, you’ve been here: “my old instrument isn’t going to do the job; it isn’t selective/sensitive enough.” At this point, you’ve started looking for ways to justify the expense of that shiny, new instrument you’ve had your eye on – the one with the state-of-the-art detector… only to be stopped in your tracks by limited budget. When you hit that wall, it’s worth remembering that a little innovation can go a very long way. A common challenge is the identification and/or quantification of very low-level components in complex matrices. Co-elution is something every experienced chromatographer has faced, and there are numerous approaches used to resolve the peaks. With the best will in the world, deconvolution can only take us so far. For samples that contain large amounts of component X that co-elutes with trace levels of component Y, reliable identification and quantification of both components can be extremely difficult, even with laborious sample preparation. In such circumstances, high end instrumentation can be a logical choice, but is far from the only option.
One of us (LJ), a flavor chemist at the Waltham Centre for Pet Nutrition, Mars Petcare, has been working on odorant identification and quantification for some time. An obvious problem encountered when working with odorants is the subjective nature of their detection. On many occasions, I hit a situation shared by many of us: “I know something else is there, but I just can’t see it”. I had confirmed that odorants were present in the samples by using a much more selective and sensitive detector than is commonly available for your chromatographic system of choice – the human nose. However, I could not detect – let alone identify – the odors as peaks in the chromatogram with the gas chromatography (GC) tools that he had available, and was resorting to large quantity sample preparation and additional separation by orthogonal techniques, before GC analysis. These additional steps were extremely time consuming. What was needed was a means of both (i) identifying and separating components of interest present at low levels in complex matrices, and at the same time (ii) improving sensitivity to such a degree that components present at ‘undetectable’ levels could be reliably identified and even quantified.
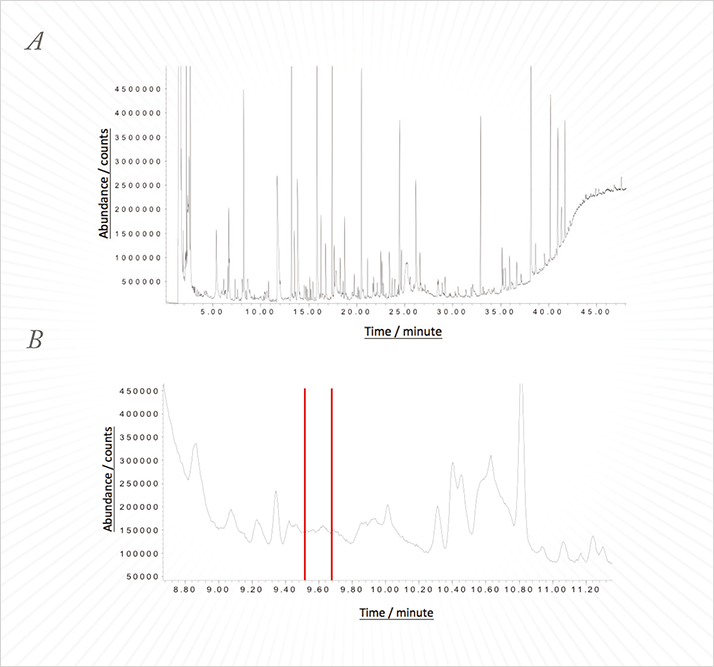
When we first met, Lewis was using GC to separate the volatile organic compounds, combining it with three detectors: an olfactory detection port (ODP) to detect odor-active peaks, a pulsed flame photometric detector (PFPD) to detect the presence of sulfur-containing moieties, and a single quadrupole mass selective detector (MSD) to identify components. Even following sample preparation by solvent assisted flavor evaporation (SAFE) and distillation, the resulting chromatograms were close to the peak capacity of the column and showed a high level of background noise, caused by the complex nature of the matrix involved (see Figure 1). Furthermore, this approach came with its own set of problems; odors were detected in a region of the chromatogram where only odor-inactive compounds could be identified, and no peaks corresponding to the odors were visible on either the MSD or the PFPD. Ruling out misalignment of the detectors, the conclusions were clear – some odorants were masked by co-eluting peaks in the MSD and some were present at levels below the detection limit of the MSD and PFPD.

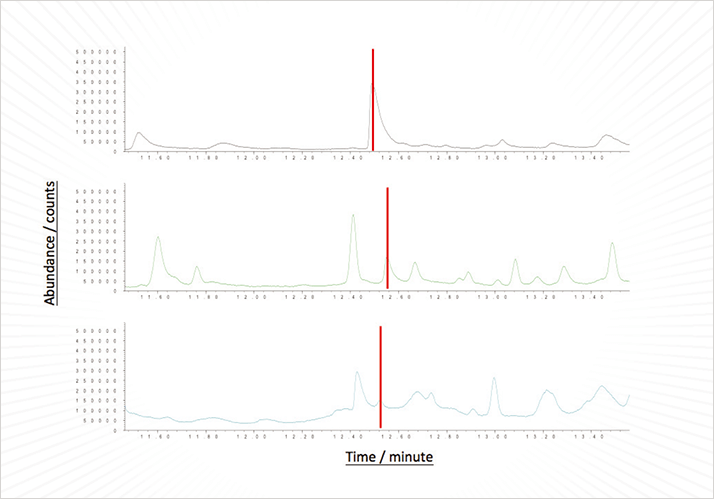
To reduce the complexity of the chromatograms, samples were routinely fractionated into into basic, neutral and acidic fractions, reducing the number of components present in each injection, and hence, reducing the chance of co-elution. This approach has previously confirmed the presence of co-eluting peaks and the presence of co-eluting odorants (see Figure 2). It is important to note that the human nose is capable of detecting more than one odor at once.

Now, the situation had become even more challenging: according to the odors emitted from the ODP, multiple co-eluting odor-active components are present at levels not detectable on the current system.
It was at this stage that I (LJ) approached JSB. Armed with the information I had generated from his work to date, and my knowledge of the workings of the human nose and odorants, I presented the problem of finding an objective analytical system equivalent to the human nose. In simple terms, it can be broken down as follows: the sensitivity of a single quadrupole MSD is in the region of approximately 1pg (scan), the sensitivity of PFPD is approximately 1pg/sec, and that of a high-speed time-of-flight (TOF)-MS is in the region of approximately 0.1pg. The human nose can detect some compounds down at levels as low as approximately 400ag, way below that of commercially available GC detectors. Together, we needed to devise a system that could identify unknown compounds present at very low levels in extremely complex matrices, which, in some instances, will co-elute with each other and with components present at levels many orders of magnitude higher than the components of interest.
I informed JSB that I was interested in the resolving power of a two dimensional (2D) GC, but also wanted the fraction collecting ability of a preparative GC, in a single easy-to-use, robust, automated system! I had ideas, but did not know which were technically viable, and had no experience of developing a bespoke, complex GC system. Fortunately, Bryan White (UK country manager at JSB) was available, working with me to design a system to meet all requirements. Bryan proposed heart-cutting peaks or regions of interest – where odors were detected – in the chromatogram onto a second column with a different phase for 2D chromatography in isolation. This solution certainly facilitates the separation of a co-eluting peak; however, the key to improving sensitivity was the addition of a large-capacity cryo-trap after the heart-cut. Using an Agilent 7890B with an Agilent 5795C MSD, we initially used an Agilent capillary flow technology (CFT) plate to heart-cut regions from the first dimension into a SIM Ice Cube cryo-trap packed with glass beads held at -20 °C, to trap the components. This has the advantage of allowing multiple injections onto the first dimension, heart-cutting the same region each time, concentrating the components in the trap. When a second analytical method heats the trap the components are released and separated in the second dimension before detection by MSD and ODP.
Results from initial tests using a mixture of alkanes and a sample extract looked promising, but then we hit a couple of snags. Bryan is anosmic – having no sense of smell makes this work particularly difficult, which is why I (AW) took over. I developed the GC method to separate out the alkanes to allow calculation of Kovats retention indices on the first dimension and set about doing the same on second by cutting all of the alkanes into the trap. However, it became apparent that glass beads at -20 °C would not trap the required range of alkanes (and all of the components of interest based on their retention indices). Reducing the temperature was not an option with a Peltier cooling system, so I replaced the glass beads with Tenax, which solved the issue. The system was ready. We successfully cut out a single peak from the alkanes mix and concentrated it on the trap using repeat injections and heart-cuts. The peak area of the component eluted from the trap after five injections was five times that of the same peak in an uncut sample, demonstrating that the trapping was linear. The system worked, but I wanted to push it, and show the system’s full potential before leaving it with our customer. Lewis was keen to help and created a sample of what he described as ‘a very difficult co-elution’ of known components (see Table 1). This was a mixture of five odorants that all co-eluted with high levels of acetic acid, a sixth odorant, often found in meat and fish based samples.
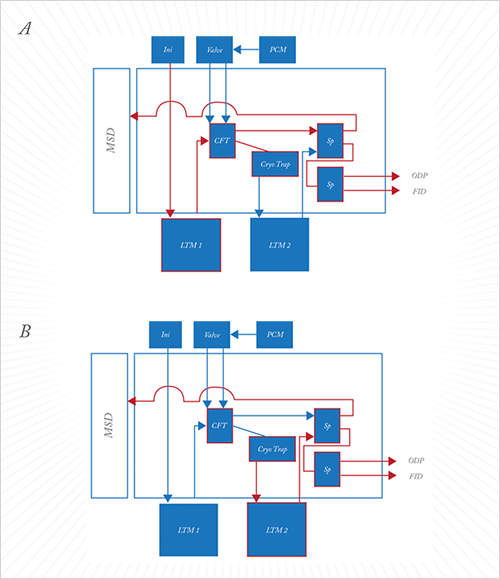
One-dimensional GC-MS-ODP showed that five odors could easily be smelt across one large, ugly peak (see Figure 3A). Other than acetic acid, the odorants could not be identified by standard GC-MS. Initially, we tried three heart-cuts of the peak onto the trap and eluted the components. This allowed us to identify two odorants, in addition to acetic acid, but there were still three missing. So we carried out 24 heart-cuts and eluted the trap contents. This allowed the other three components to be easily identified. All six odorants were successfully resolved on the second column. The second dimension successfully resolved 2-ethyl-3,5-dimethylpyrazine and 2-ethyl-3,6-dimethylpyrazine into two distinct peaks of similar odor. These two odorants produced only one odor peak on the first dimension column. But was the system linear at such low levels? Looking at the furanmethanthiol (TIC) peak areas, the ratio of the peak area after 24 heart cuts to that after three heart cuts was 8.3:1. The corresponding value for the 1-octen-3-ol peak was 7.9:1. Promising results! So how could the system be improved? The oven was looking more than a little intimidating with all of the connections inside. I (AW) changed both columns to low thermal mass (LTM) units so they were sat outside the oven, which facilitates column changing and has the advantage of independent temperature programming for the two columns. I also connected a flame ionization detector (FID) to facilitate quantification. A schematic of the final system is shown in Figure 4.

We think we can claim success with this solution. We worked together closely throughout and the scientists at Mars Petcare are using it routinely. The facts are; it is easy to implement, adaptable (by the simple exchange of LTM columns), and doesn’t require vast quantities of cryogen. Most importantly the potential applications of the system are vast – essentially any application looking at low-level components in complex matrices. The system is also useful for particularly difficult co-elutions (chiral columns can be used to separate enantiomers, for example). Another potential use would be automated sample screening for very low-level components – sequential runs taking different cuts and concentrating components eluting in regions of interest. But that is for another day.
Andrew Ward is support engineer and application specialist for JSB (www.go-jsb.com), Maidenhead, UK. Lewis Jones is a flavor chemist at the Waltham Centre for Pet Nutrition, Mars Petcare.


