The -omics era has inspired creativity across analytical chemistry by posing interesting new challenges. In my case, the stimulus to think about new materials for separations came at the 1999 Gordon Conference on Analytical Chemistry, which included the emerging field of proteomics. I was taken aback by the images of stained two-dimensional gels, which are riddled with streaks, especially for large proteins, and wondered why no-one commented on these and how they must hide lower abundance proteins. When I asked, people said “that’s just the way it is”. The gel images made me think about what kind of material could enable protein electrophoresis without streaks.
Around the same time that proteomics was emerging, photonics had become a hot topic in physics. A photonic material strongly filters out a narrow band of light by using diffraction instead of absorbance. In 2001, I read a paper on silica colloidal crystals, which are made of submicrometer silica particles. When the sizes of these particles are on the order of the wavelength of light, diffraction occurs in the visible part of the spectrum, imparting color. In fact the beauty of gem-quality opals is familiar to everyone, and these are silica colloidal crystals that occur in nature. To show what caught my interest in the paper, Figure 1 shows a scanning electron microscopy (SEM) image obtained later from our own lab, as well as a photo to demonstrate that the material has color. What jumped out at me from the SEM image was the extraordinary homogeneity. I saw this as potentially the ideal separation medium. The holes between the particles are the right size for electrophoresis, and the size of the holes can be varied by varying particle size. The streak problem should be solved because there are no small pores that would trap proteins. They might even be useful for chromatography. These thoughts motivated me to start studying silica colloidal crystals.
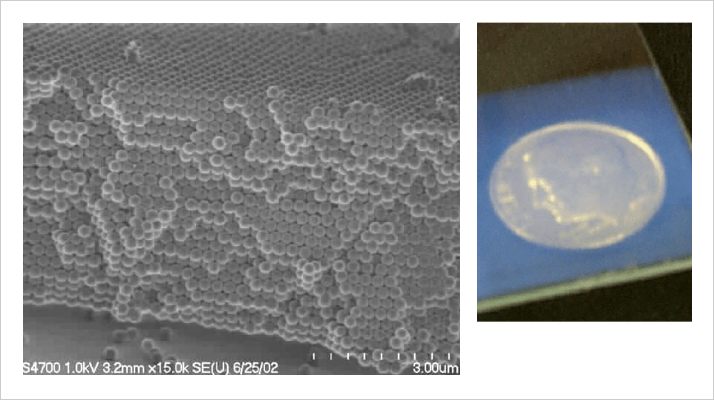
I was at the University of Delaware at the time, and I convinced a brave graduate student that these materials were worth working on. We bought the necessary reagents and started to make the silica particles, and then we formed silica colloidal crystals on microscope slides. The university had just acquired its first field-emission SEM, which allows imaging of non-conducting materials, and my student became skilled at operating it. She coated some slides and took the SEM image in Figure 1; I snapped the photo. We were on our way. We quickly got pretty good at making these materials, and I wrote a proposal to the National Institutes of Health (NIH) to study protein electrophoresis. Usually these stories end with the reviewers being so skeptical that the proposal was declined, but that did not happen in this case. The NIH study section thought the risk was worth taking, and the research was funded. But there was an odd wrinkle: one reviewer was apparently so struck by the beauty of Figure 1 that he or she said we could not have done it ourselves. Hey, thanks for the vote of no confidence there. Anyway, I got a phone call from the NIH misconduct office asking me about the origin of the image. I explained that we made the material and we imaged it. I think they realized the reviewer had simply made a careless comment, giving no basis for the claim that the image came from elsewhere. We got the funding, so we were able to start in earnest. I will be forever grateful to the supportive reviewers for taking this risk. We published the first electrophoresis results for these media, using DNA fragments to confirm that the pores enable sieving. We have done quite a bit of electrophoresis in the years since then, and indeed, there are no streaks because proteins are not trapped. We will develop many more applications of protein electrophoresis in the future, but the story now turns to liquid chromatography (LC).
When we started working with these materials, I never imagined that we would someday be using pressure-driven flow through silica colloidal crystals. Geologists consider opals to be nonporous rocks. The crystalline structure is so tightly packed that it ought to take enormous pressures to flow liquid through it. But we were curious about how the material would perform in chromatography, so we started doing electrochromatography of proteins. This uses electric-field-driven instead of pressure-driven flow, differing from electrophoresis by allowing the protein to reversibly adsorb to the surface. We learned to pack capillaries well, after a few years of fighting cracks and wall gaps. The electrochromatography results were amazing: in 2010 we published a van Deemter plot in Analytical Chemistry (2) revealing that diffusion was the only contribution to plate height. The minimum plate height was about 10 nm, orders of magnitude smaller than anything ever seen for a chromatographic medium. The contribution to broadening from the material was zero, with an error of about 5 nm. This means that the material is indeed extraordinarily homogeneous.
How we started on this avenue was that we wanted to see whether our material would accidently slide out of the capillary since we were using no frit. A collaborator on the US east coast had a pump that went up to 12,000 psi, and she used methanol to test flow rates for a few of our capillaries. One capillary blew out the packing, but the others held up to the maximum pressure, and they gave consistent pressure-flow curves. She found that she could easily get enough flow for stable nanospray. This was significant because it indicated that one could potentially use silica colloidal crystals for LC mass spectrometry (LC-MS). Since the flow behavior was incidental to the electrochromatography paper, we put it in the supporting information and mentioned it in the context of future significance. I had no idea how important this seemingly minor point was.
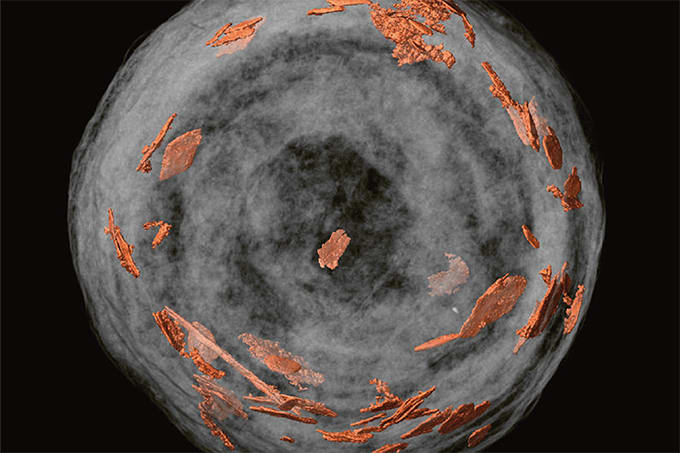
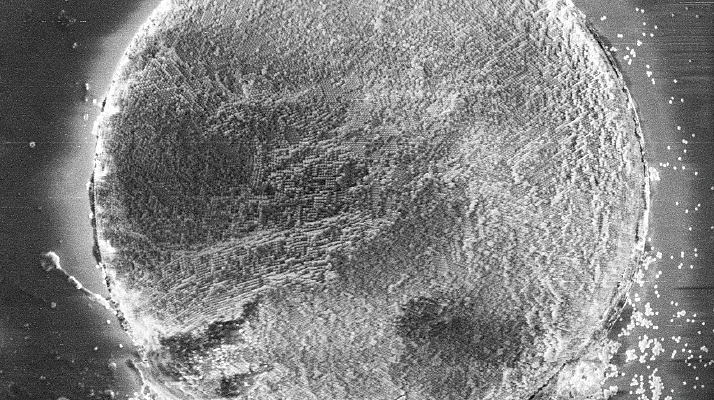
There used to be a detective show on TV decades ago with a character called Lieutenant Columbo. He always found a seemingly minor piece of evidence that was the key to unraveling the murder mystery. Science is much the same way, and this is why reviewers will sometimes zero in on what might look like a minor point to you as an author. In this case, the late Uwe Neue of Waters was Lieutenant Columbo. He calculated that our flow rates were impossibly high. He was right, the high flow rates pointed to the material being loosely packed, but our SEM images established the material was packed tightly. We exchanged several emails, agreeing that the behavior was perplexing to both of us. Neue published a commentary on our paper in which he proposed that the beautiful crystalline structures one sees in the SEM images are only on the outside, and that the material was randomly packed inside (3). This was a reasonable conjecture, but we wrote a response pointing out that we see crystalline domains when we cleave the capillaries. An illustration of what we typically see in the lab is presented in Figure 2 and Figure 4. Our own conjecture was that there must be enough vacancy defects to support a higher flow rate (4). We were both wrong, but it would be a while before we figured this out.
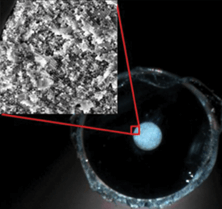
We bought a high pressure pump and began to investigate protein ultrahigh pressure liquid chromatography (UHPLC). We expected that the plate heights would be much worse with pressure-driven flow because theory predicted that the smallest possible plate height was equal to the particle diameter. We were using 470 nm diameter particles, so we expected to observe 470 nm plate heights, at best. Instead, we were in for another surprise: the plate heights were an order of magnitude smaller. One protein gave a plate height of only 15 nm. This was 30 times smaller than theory predicted. Whenever we get a really surprising result, as long as it is reproducible, I tell my students this: the good news is that we learned something important, the bad news is that it will be a dogfight to get it published, no one will believe it. We submitted the work for publication in 2011, and it was soundly rejected by all three reviewers. We spent a considerable time revising it to address the extensive comments and questions by the reviewers, and we re-submitted it. It was rejected again. The associate editor told me he never wanted to see this work again. There were two main problems. First, the small plate heights were so much smaller than theoretically impossible. Second, the flow rate indicated random packing, just as it had for methanol in our earlier work, yet the photo of the capillary exhibited the opalescence that you would only get with crystallinity. These two results made no sense. One reviewer suggested that we selected results from very different capillaries and pieced them together as though they were from one, violating ethical practice. I took great umbrage at the time, but I can see now that the reviewer was just trying to find an earthly explanation for the contradictory results. In retrospect, I probably would have rejected the paper, too, if I were a reviewer.
We would soon figure out what was going on with the plate height and flow rate. My students were distressed about the paper being rejected after all of their hard work. Being older, I do not get as upset anymore. I told them that a correct new result will eventually see the light of day. I decided to relax and do some general reading. You may have noticed how your mind always works on a problem, even when you are not conscious of it. That was the case for me. I dug up a paper I had read a few years earlier and had filed it away as a curious observation. It was the 2005 paper in Nature by Majumder et al. (6) about something called slip flow, which enables high flow rates of water through carbon nanotubes. Slip flow is explained in more detail a little later here, but for now the essential idea is that slip flow enhances the flow rate when a surface is poorly wetted by a liquid. I instantly realized that slip flow might be responsible for our anomalously high flow rates, and possibly even our low plate heights. I was excited, but before jumping out of my chair and running to the lab, and perhaps needlessly alerting my students, I read a few other papers. Our interstitial dimensions seemed right for slip flow. Since our surfaces were chemically modified with hydrocarbon chains, it occurred to me that we could design an internal check: compare the flow rates for water and toluene, since one is nonwetting and the other wetting. I emailed my students a copy of the Nature paper and stated my new conjecture. After reading my email message, one of my graduate students leapt up and ran into the lab to make flow rate measurements. He quickly had the answer: we had slip flow. The flow rate for water was five-fold higher than that predicted from the flow equations used for chromatography, while toluene matched the prediction. Slip flow thus explained why a tightly packed crystalline medium would give the same flow rate predicted for a looser, random packed medium when the non-wetting acetonitrile and methanol solvents were used. We wish Uwe Neue had lived to hear the answer to his question about why our flow rates are so high.
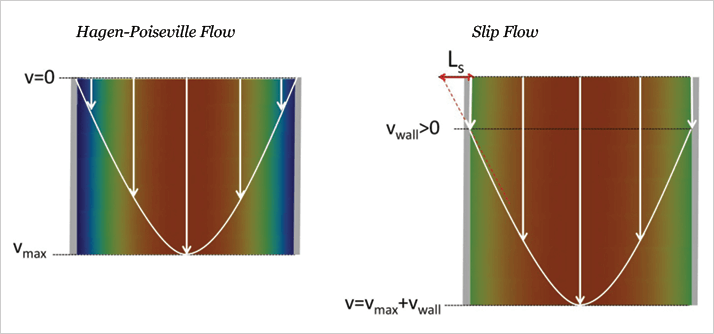
We revised the paper to include slip flow results, and submitted it to a higher impact journal. It was accepted as a Journal of the American Chemical Society (JACS) communication without drama (5). Slip flow is actually an old topic in fluid dynamics. I believe the first paper was published in 1823 by Navier (7). This early paper explains that you have a choice when you predict the flow rate: you can have the velocity of the liquid be zero at the wall, which is what has been used conventionally in chromatography, or you can have it be nonzero, which is what characterizes slip flow. These two cases are illustrated in Figure 3, where the color code depicts the spatial distribution of the velocity of the liquid. Slip flow describes your non-stick frying pan, where the fried egg slides out in one piece when you tilt the pan. In chromatography, where the mobile phase is equivalent to the egg, having all of the liquid move at one uniform velocity makes chromatographic peaks sharper. From the Navier paper, the information needed to understand our high flow rates and low plate heights has been there ever since Thomas Jefferson’s day, we just had not made the connection.
We followed up with a paper in ACS Nano (8) on the particle size dependence of slip flow. We included multiple internal checks: my graduate student made a total of over 200 measurements: three replicate capillaries for eight different particle diameters, with at least five measurements of flow rate for water at various pressures, and the same for toluene, for each capillary (he was a high-energy graduate student). The data confirmed that slip flow enhancement increases as particles sizes decreases, in accord with theory. The results also detailed that the particle sizes used commercially in chromatography give almost no slip flow, which explains why most chromatographers had never heard of it. A few months ago, Xiaohong Yan and Qiuwang Wang published a theory paper in the Journal of Separation Science (9) that starkly disagrees with earlier theory on plate heights, predicting the minimum plate height to be more than ten-fold smaller than the particle diameter, even without slip flow. Our smallest plate height was less than a factor of three smaller than their prediction. Had they published this a few years ago, our own adventure in publishing might have been much less interesting. Maybe they would be the ones who had the interesting ride. We now understand why the flow rates and plates heights were out of the range of what was thought to be theoretically possible a year ago. Using the work of Yan and Wang, the current state of knowledge is that the plate heights for proteins can be <50 nm, with most of the improvement arising from the unusually small particle size coupled with the homogeneity of the medium, and part of this arises from slip flow. I would say that the main role of slip flow is to facilitate the use of such small particles with currently available LC pumps.
Our published work on chromatography with silica colloidal crystals was initially artisanal: students electrokinetically injected protein, then put a pressure fitting on the capillary, hooked it up to a high pressure pump, and detected the protein peaks by fluorescence microscopy. These are slow, laborious steps, and we undertook them to image the injected width, to make sure it was small. Now we are using a nanoUHPLC with an autoinjector to reduce labor and increase throughput, and the system has a dual pump to enable the gradient elution needed for protein separations. The first paper using this approach, just accepted by Analytical Chemistry, shows that there is not too much penalty with the broader injection from the commercial instrument. We are now ready to explore applications.
There are three areas we have identified where better chromatography of intact proteins ought to have a significant impact: proteomics, protein pharmaceuticals, and biomarker discovery. We are preparing our first paper on proteomics by nanoUHPLC-MS of intact proteins. The chromatograms are a far cry from the streaky and slow gel separations, and the in-line integration with mass spectrometry allows the type of automation not possible with gels. For protein pharmaceuticals, where there is a pressing need to characterize aggregation of monoclonal antibodies, we show baseline resolution of monoclonal antibody monomers from their dimers and trimers at room temperature in only a few minutes. No other separation has come close to this resolution or time scale, even at elevated temperatures. For biomarker discovery, we are picking up on leads where LC was used, but the resolution was insufficient. Overlapping peaks can undermine biomarker discovery by masking lower abundance proteins that are changing between healthy and disease states. We are evaluating studies of various cancers and cardiovascular disease.
When I was young and full of new ideas, I was inspired by stories demonstrating how the discovery process is so different from scientists yelling “eureka” from the laboratory. These stories explain that when you observe something strange, your peers expect you not just to report it, but to explain it. That is where the science begins, and it will lead you into interesting new directions and take you way out of your comfort zone. Once you are out there, you get to experience what it is really like to be a scientist.
References
- Zheng et al., J. Am. Chem. Soc., 128, 9016-7 (2006). B. Wei, D.S. Malkin, M.J. Wirth, “Plate heights below 50 nm for protein electrochromatography using silica colloidal crystals”, Anal. Chem., 82 10216-10221 (2010). U.D. Neue, “Comment on "Submicrometer plate heights for capillaries packed with silica colloidal crystals". Anal. Chem., 83 460-461 (2011). D.S. Malkin, B.C. Wei, and M.J. Wirth, Anal. Chem., 83 459-459 (2011). B. Wei, B.J. Rogers, M.J. Wirth, “Slip flow in colloidal crystals for ultraefficient chromatography,” J Am Chem Soc., 134, 10780-2 (2012). M. Majumder, et al., “Nanoscale hydrodynamics: Enhanced flow in carbon nanotubes”, Nature, 438, 44 (2005). C.L.M.H. Navier, Memoirs de l’Academie Royale des Sciences de l’Institut de France, 1, 414-416 (1823). B.J. Rogers and M.J. Wirth, “Slip flow through colloidal crystals of varying particle diameter,”ACS Nano, 7,725-31 (2013). X. Yan and Q. Wang, “Numerical investigation into the effects of ordered particle packing and slip flow on the performance of chromatography”, J Sep. Sci., 36, 1524 (2013).


