Back in 1970, when I took my PhD in analytical chemistry at The Queen’s University of Belfast, the emphasis was primarily on “chemistry”. In particular, I was working on electrochemical methods of analysis for pharmaceutical compounds. I’ve spent my entire career either teaching analytical chemistry or conducting pharmaceutical analyses, travelling widely in Africa, Australia and Europe. I finally settled at the University of Ulster, where I am currently an active Emeritus Professor in the School of Pharmacy. Over the years, my interests have changed somewhat – I became more heavily involved in bioanalysis and moved towards mass spectrometry-based techniques – but despite these changes of direction, chemistry has always been at the center.
I consider myself an “old school” analytical chemist, and I’ve noticed that all around me the “chemistry” part of my field is less and less obvious – analytical chemistry has become analytical science (as emphasized by the title of this very magazine!). That’s not entirely a bad thing – it means we’ve embraced a much wider scope in terms of science and applications. The problem is that you can’t simply forget about the exciting and interesting chemistry occurring (nowadays very much in the background) to enable a particular analytical method. Teaching of pharmaceutical analysis is generally carried out via the subdivisions of techniques. The field divides naturally into spectroscopy techniques, for example, infrared (IR) or ultraviolet (UV) spectroscopy, and nuclear magnetic resonance (NMR); chromatography techniques, for example, thin layer chromatography (TLC), gas chromatography (GC) techniques, and high performance liquid chromatography (HLPC); and electrochemistry techniques, for example, potentiometry and polarography. Specific applications are typically addressed within the confines of each particular technique.
However, over the years I have come to organize the teaching of “the analytical method” slightly differently. Instead of focusing on individual techniques, I advocate considering the individual unit processes (representative sampling, preliminary sample preparation, separations, and so on) that make up the overall method. The journey begins with the definition of the problem: how do I find analyte A in matrix X? That could be as simple as finding an active pharmaceutical ingredient in a tablet with one other excipient; it could be as complex as trying to separate several drug degradation products and metabolites at very low concentrations in a hair or plasma sample. But in either case, I’ve always stressed the importance of the different unit processes and how each one plays its part in getting the best analytical result to solve the problem. It’s a rather more systematic way of approaching method development that really highlights the fact that you not only have to understand the instrumental technique you’re using, but also the origin of the sample and how best to handle that sample type for that chosen instrumental technique. I suppose it’s my way of coercing students into a deeper consideration of the chemistry – and other processes – involved.
In this article, I offer examples from my past experiences to emphasize the importance of each unit process. Along the way, I also hope to highlight some interesting chemistries that have been invoked to produce the best results from a particular instrumental technique.
I’ve stated that a complementary approach to a techniques-based teaching program is to more deeply consider the unit processes of pharmaceutical analysis. So, what are the unit processes? They are:
- the choice of technique
- the method used to obtain a representative sample
- the preliminary treatment of the sample
- the separation of desired constituent(s) from each other and from interferences
- the measurement (and its statistical assessment)
- calculation of the result.
Pharmaceutical analysis is concerned with the identification (qualitative analysis) and/or determination (quantitative analysis) of, mostly, organic substances in either simple matrices (drugs dissolved in solvent) or complex matrices (drugs and metabolites in blood, urine or hair) – see sidebar 1980s Pop Quiz for two examples. Clearly, a pharmaceutical analyst must be capable of designing, performing and interpreting measurements within a diverse world of problems. Extracting meaning from the results is the final essential piece in the puzzle.
There are three points to consider with respect to technique choice. One, it is dependent on the methodology and instrumentation available in the pharmaceutical analytical laboratory tasked with solving the problem. Two, the chosen method must give results within the necessary practical parameters, such as time and cost per sample analyzed. Three, the method must be suitable for its intended purpose – all the steps needed to generate qualitative and quantitative analytical results must be validated. With regard to the last point, a three-step approach commonly adopted by the pharmaceutical industry is outlined below, using HPLC as an example.
- System validation: the wavelength accuracy of the detector, the flow and compositional accuracy of the pump, and the precision and sampling accuracy of the autosampler must be assessed.
- Method validation: the performance of the analytical method, including sample preparation, must be verified. Accuracy and recovery, precision, selectivity/specificity, linearity/calibration curves, limits of detection, limits of quantitation, ruggedness, robustness and stability must all be evaluated. The number of parameters that have to be assessed depends on whether the information is to be used for contract analyses, regulatory submission or laboratory accreditation.
- System suitability testing: a routine sample analysis must be carried out daily using the validated instrument and method. Usually, two or three of the validation criteria suffice to check the validity of the system, for example, precision of amounts, resolution between two peaks, and the tailing factor in HPLC.
Liquid sampling is relatively simple if the solution is homogenous but for solid samples a more detailed consideration of what is or is not representative is needed. Let’s use the European pharmacopoeia (PhEur) UV assay for chloramphenicol capsules as a typical example: “Dissolve a quantity of the mixed contents of 20 capsules containing 0.2 g of chloramphenicol in 800 ml of water, warming if necessary to effect solution, and add sufficient water to produce 1000 ml. Dilute 10 ml to 100 ml with water and measure the absorbance of the resulting solution at the maximum at 278 nm. Calculate the content of C11H12Cl2N2O5 taking 297 as the value of A (1 percent, 1 cm) at the maximum at 278 nm.” So, in this example, 20 capsules are considered representative of a given batch. “Is my sample representative?” – if you’ve not asked yourself that question, then exactly what are you measuring?
Of course, the sample type defines the required preliminary treatment. Certainly, the efficient dissolution of solids is a prerequisite to further unit processes (as noted above for chloramphenicol dissolution, “warming if necessary to effect solution”). Yes, this is very basic science, but it can sometimes be forgotten in the rush to start injecting and analyzing. Biological samples can be much more complex. For plasma, anticoagulant must be added to the blood sample to prevent clotting. On the other hand, in serum analysis, the blood sample is allowed to clot, then centrifuged. The protein is then precipitated using perchloric acid and, finally, reversed phase HPLC of the aqueous supernatant can be conducted for drug and metabolite analysis. Once again, relatively simple steps – but I suspect a few of you have encountered a destroyed column after an unsupervised novice injected blood (or some other incompatible matrix) directly into your instrument… Once again, if we haven’t even considered this unit process, we could inhibit our success in later steps. The assessment should encompass whether something new been developed that could speed up or improve preparation. It’s easy to continue blindly following outmoded techniques, if the question never enters our mind.
Separation techniques abound, each with advantages and disadvantages. There’s a lot to consider here, so I’ve provided a couple of examples that I’ve come across over the course of my career that I think are nicely illustrative. The question here again is, “Does a newer and better alternative exist?” The GC analysis of methadone and metabolites (see Figure 1) illustrates the use of solvent extraction prior to instrumental analysis (2).
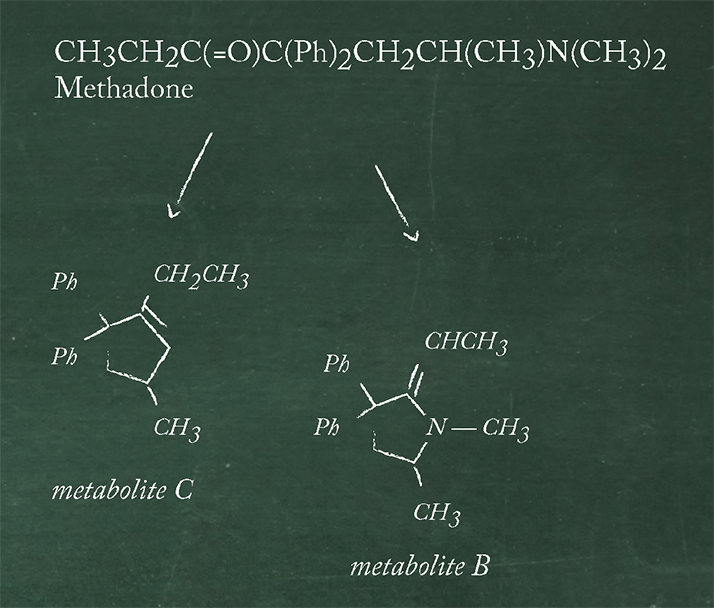
The following steps typically are typically performed in advance of GC-flame ionization dector (FID) analysis:
- Plasma pH is adjusted to 9.8, after addition of internal standard.
- Solvent extraction of neutral species into n-butyl chloride.
- Back extraction of protonated species into 0.2M HCl
- Separation of aqueous phase, made alkaline with 60% NaOH.
The final solvent extraction step is carried out using chloroform into which the neutral species are extracted and, after evaporation to dryness, the residue is dissolved in a small volume of chloroform prior to a portion being injected on a GC column with 3% SE-30 stationary phase and a temperature of 200 o C. In this example from 1972, recoveries are greater than 95 percent and are obtained with retention times of 2.3 min for metabolite C, 3.2 min for metabolite B, methadone at 4.7min and 8.8 min for the internal standard.
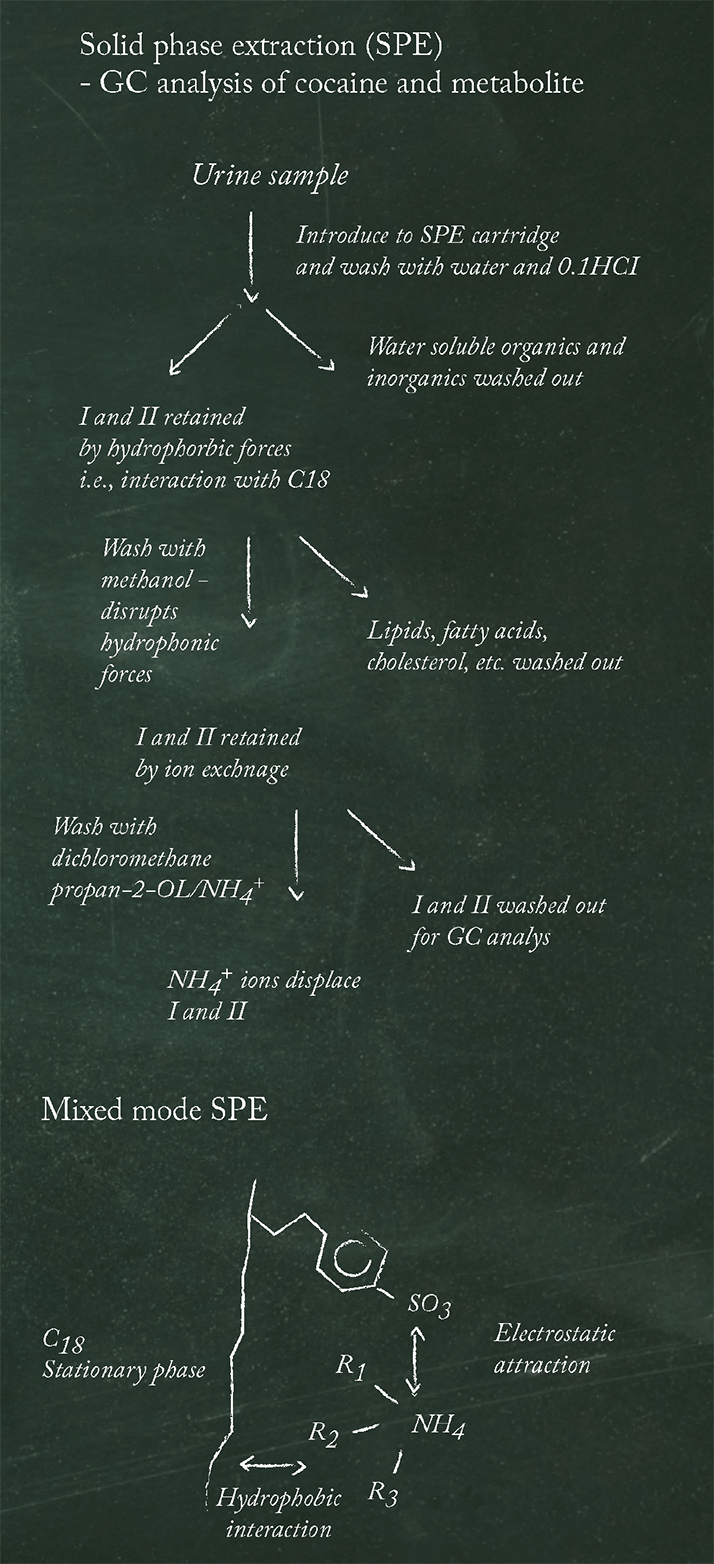
Solid-phase extraction (SPE) has taken over from solvent extraction in many cases because it negates the disadvantages of individual operator variations, hazardous solvents and relatively unselective extraction. There are many variations (for example, the wash processes and solvents used) that are dependent on the analytes to be extracted. SPE has the additional benefit of automation potential and can be used online with HPLC. A good example of SPE use can be shown in analysis of cocaine and its principal metabolite, benzoylecgonine ahead of GC (3), which is illustrated in Figure 2. Note the interesting dual-retention chemistry used in mixed-mode SPE.
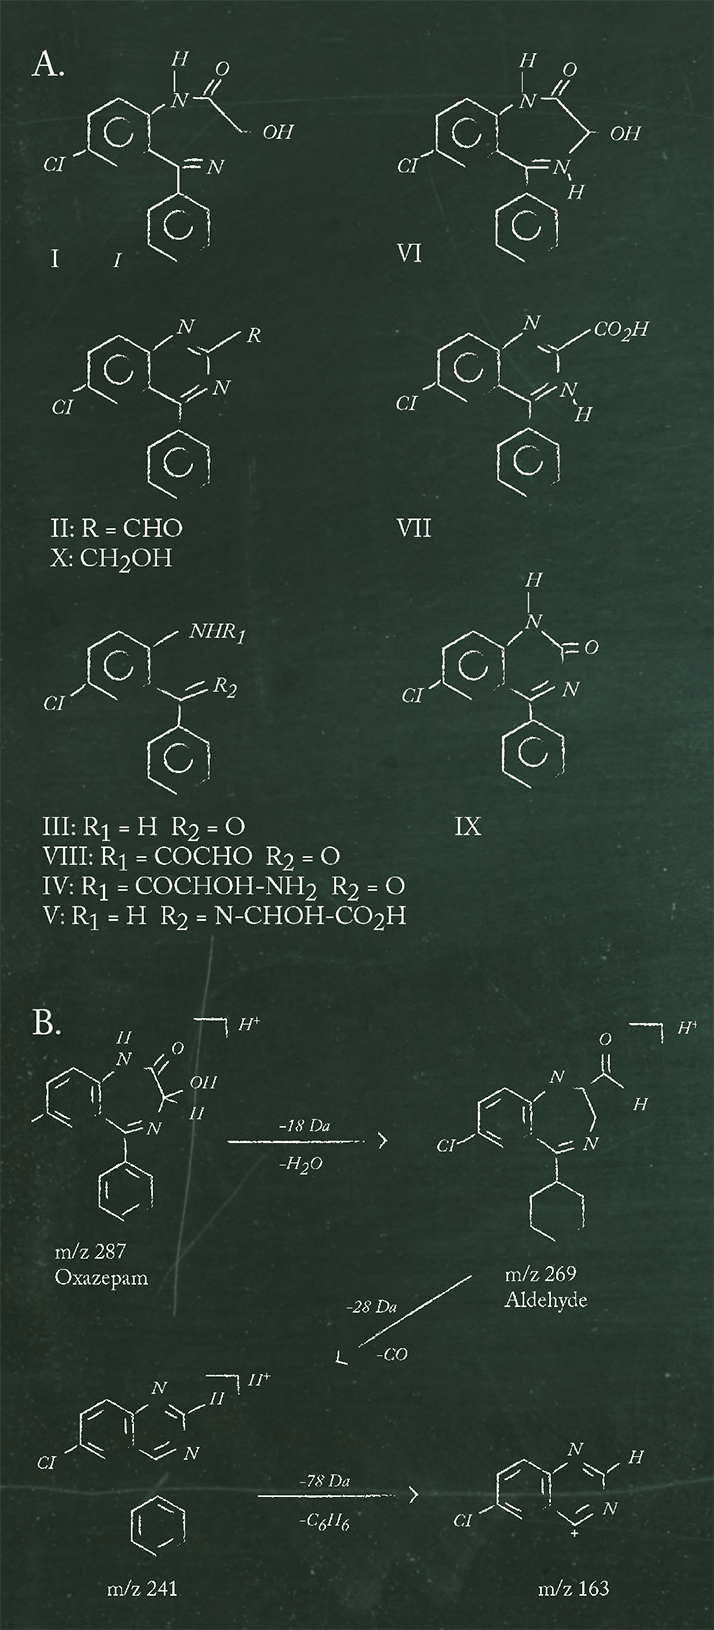
Chromatographic techniques are used extensively to separate desired constituents from each other and interferences. In pharmaceutical analysis, it is not uncommon to be able to detect a drug and its process impurities or degradation products in a single scan. For example, in 1995 Husain et al. reported that reversed phase HPLC analysis of ciprofloxacin and process impurities DCFA, Q acid, CPA, CFA could be carried out in a single scan lasting only 7 min (4). Even earlier, Reif et al. published a stability indicating assay for oxazepam (I) and seven of its degradation products (II, III, VI, VII, VIII, IX, X, see Figure 3) down to 0.1% levels, in a single 20 min scan using reversed phase HPLC analysis (5).
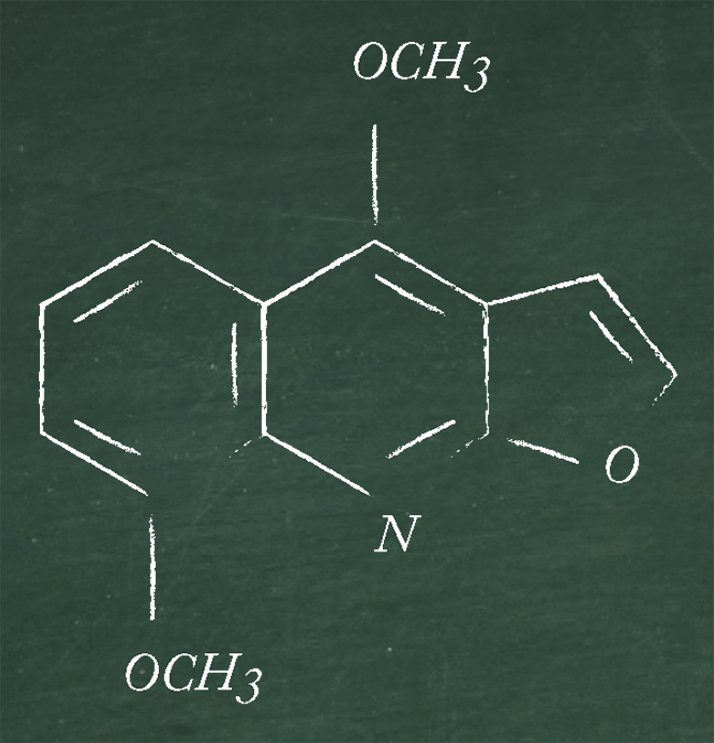
I can offer a personal example of a complex combination approach that may be required in certain instances. My colleagues and I reviewed the of phytochemicals in selected plants using a combination of separation processes followed by electrospray ionization ion trap mass spectrometry (ESI-MSn) and LC-ESI-MS (6). Dereplication (or counterscreening) aims to isolate unknown bioactive candidates from known bioactive chemicals. Crude extracts of selected plants were subjected to column chromatography, the resulting fractions being tested for their bioactivity towards organisms, such as methicillin-resistant-Staphylococcus aureus (MRSA). The bioactive column chromatography fractions were further separated by preparative TLC to yield a series of bands, which were subjected to LC-ESI-MS and ESI-MSn. The resulting retention times, molecular masses, and fragmentation patterns were used alongside Chemnet and in-house quinoline databases in the dereplication process to elucidate the structure of some of the compounds by comparing them with known structures of natural origin. Some molecular masses and the corresponding fragmentations did not correlate with any known compounds thus revealing potentially novel natural products that could be investigated on a larger scale and could ultimately find application as new drugs against MRSA and other multi-drug resistant microorganisms. To illustrate the dereplication process, let’s look at the identification of γ-fagarine (see Figure 4) in the plant Ruta graveolens. An [M+H]+ ion for TLC band 5 was observed at m/z 230. This ion fragmented at MS2 to generate a product ion at m/z 215, indicating the loss of a methyl radical. The product ion then lost 28 u at MS3 to generate an ion at m/z 187. On referring to the quinoline database, γ-fagarine gave identical fragmentation as observed for this ion. Furthermore, LC-ESI-MS analysis revealed that the retention times of the compounds also match at ca 10.2 min.
Chemical measurements, such as titration, are still used to a certain extent in PhEur assays – particularly in industrial quality control, but instrumental measurements (for example, LC with diode array detection) are now very widely used in pharmaceutical analysis – we’ve already covered several examples of those above. In terms of statistical analysis, in addition to standard deviation, three other commonly used tests in pharmaceutical analysis are: 1) Q test, for removal of insignificant data. To apply a test for bad data, the data are arranged in order of increasing values and Q is calculated by dividing “gap” by “range”, where gap is the absolute difference between the outlier in question and the closest value to it. In terms of Q tables, if Q (experimental) is larger than Q (critical), the questionable value is rejected. 2) t test, for comparison of means of data sets. If there is an accepted value for the result based on extensive previous analysis, t (experimental) can be calculated and compared with t (critical) in the t table. If t (experimental) is smaller than t (critical) for the appropriate number of degrees of freedom, then the difference between the means is not significant. 3) F test, for comparison of the precision of data sets. The F test is used to test for differences among sample variance. Like the Student’s t test, an F value is calculated and compared to one in the F table.
Correct statistical analysis is worth a feature in its own right. I covered it in detail in my book (7), but there is a plethora of sources available to provide a refresher course. Needless to say, given its importance, it should always be subject to a significant degree of consideration.
In terms of identification or qualitative analysis, let’s go back to the oxazepam example. We used semi-preparative HPLC to separate and isolate oxazepam and its degradation products and characterized them using ESI-MSn (8). Structures of proposed degradation products and their fragmentation patterns were supported by ESI-QTOF-MS/MS investigations to obtain unequivocal confirmation. The proposed ESI-MSn fragmentation pathway of oxazepam and the degradation product 6-chloro-4-phenyl-2-quinazolinecarboxaldehyde are given as an example in Figure 3b. ESI-QTOF-MS/MS confirmed the m/z 269 signal as C15H10N2OCl (1.5ppm) and the m/z 241 signal as C14H10N2Cl (1.0ppm).
For quantitative analysis, calibration curves, standard addition methods, internal standard methods, and internal normalization method are all used readily. A particularly good example of the internal standard method can be found in a 1990 paper on the analysis of fluoxetine and its metabolite in serum by HPLC (9). Some things never seem to go out of fashion!
I hope with this article that I have either triggered some memories or opened some eyes on the absolute need to consider the individual unit processes of methods. Interestingly, I was searching on Google the other day and noticed that in organic synthesis, chemical engineering and many other fields, overall methods are approached in the form of unit processes. Just as I’ve described above, it’s all about splitting up an overall method into discrete operations or steps. In our modern world of faster, more accurate, higher resolution – and automated – instrumentation, it can be easy to forget the basics. Sure, if you find that your trusty LC-MS isn’t sensitive enough to detect a new analyte of interest in a particular matrix, you could race to your nearest instrument vendor for the latest and greatest innovation. Or you could take a step back and reconsider each unit process in turn: the use of a different preliminary sample preparation step or the addition of some interesting solid phase extraction chemistry could be just the trick to enable detection. In short, let’s not lose sight of the basics in our rush to embrace sophisticated technology.
I’ve selected a couple of problems that I faced in my career. I present the solutions we used back then. Test yourself by thinking about how you would deal with the following scenarios today.
Problem A
The veterinary pharmaceutical levamisole (immunostimulant, antihelminthic) can contain 6-phenyl-2,3-dihydroimidazo[2,1-b]thiazole as a toxic impurity (see Figure 1 for structures). How could the quality control unit of a manufacturer ensure that levels remain below a certain threshold value using a simple, inexpensive and rapid test?
Our method: Perform TLC (chosen for speed and cost effectiveness) on 10 µL of the suspect raw material made up to 5 percent w/v on silica gel with toluene and glacial acetic acid as the mobile phase, visualizing with potassium iodoplatinate solution (brown, blue and purple spots with many basic (as opposed to acidic) drugs. Conduct TLC on 10 µL of pharmacopoeia standard made up to 0.025 percent w/v using the same conditions.
Our solution: If the TLC spot from the suspect solution is more intense than the spot for the standard solution, there is a 0.5 percent or higher impurity level.
If you are familiar with the current European pharmacopoeia, you may know that 6-phenyl-2,3-dihydroimidazo[2,1-b]thiazole and four additional impurities from manufacture and degradation must now be analyzed by HPLC with UV detection at 215 nm to ensure compliance.
Problem B
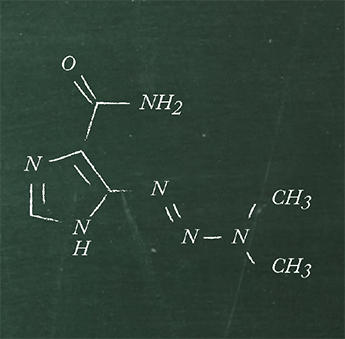
How can clinicians quickly and easily quantify the amount of anticancer drug dacarbazine, normally administered at 250 mg per day to a patient undergoing chemotherapy, to assess the best dosing regime?
Our method: Sample blood, allow to clot and centrifuge. The clear serum is subjected to protein precipitation with, for example, HClO4. Protein-free serum is then analyzed by reversed phase HPLC-UV.
Our solution: Under the above HPLC conditions, dacarbazine elutes at 14 min (separately from biological interferences), permitting its quantitation and hence providing the clinician with data on which to base administration of the drug (1).
What methods did you suggest?

Newsletters
Receive the latest analytical science news, personalities, education, and career development – weekly to your inbox.

References
- A. J. M. Ordieres et al., “An Electroanalytical Study of the Anticancer Drug Dacarbazine”, Anal. Chim. Acta 202, 141-149 (1987). C. E. Inturrisi and K. Verebely “A Gas-Liquid Chromatographic Method for the Quantitative Determination of Methadone in Human Plasma and Urine”, J. Chromatogr. 65, 361-369 (1972). Analytichem Application Note M797, Varian Sample Separation Products (1990). S. Husain et al., “High-performance Liquid Chromatographic Separation and Determination of Small Amounts of Process Impurities of Cciprofloxacin in Bulk Drugs and Formulations”, J. Chromatogr. A 705, 380-384 (1995). V. D. Reif and N. J. DeAngelis, “Stability-indicating High-performance Liquid Chromatographic Assay for Oxazepam Tablets and Capsules.” J.Pharm.Sci. 72, 1330-1332 (1983). W. F. Smyth et al., “Dereplication of Phytochemicals in Plants by LC-ESI-MS and ESI-MSn”, Trends Anal. Chem. 33, 46-54 (2012). W. F. Smyth, “Analytical Chemistry of Complex Matrices”, 51-55 (J. Wiley and Sons, ISBN 0-471-963-16X, 1996) T. J. Smyth, V. Rodríguez Robledo and W. F. Smyth, “Characterisation of Oxazepam Degradation Products by High-performance Liquid Chromatography/Electrospray Ionisation Mass Spectrometry and Electrospray Ionisation Quadrupole Time-of-flight Tandem Mass Spectrometry.” Rapid Commun. Mass Spectrom. 24, 651-8 (2010). N. Gupta Ram and M. Steiner, “Determination of Fluoxetine and Norfluoxetine in Serum by Liquid Chromatography with Fluorescence Detection”, J. Liq. Chromatogr. 13, 3785-3797 (1990).