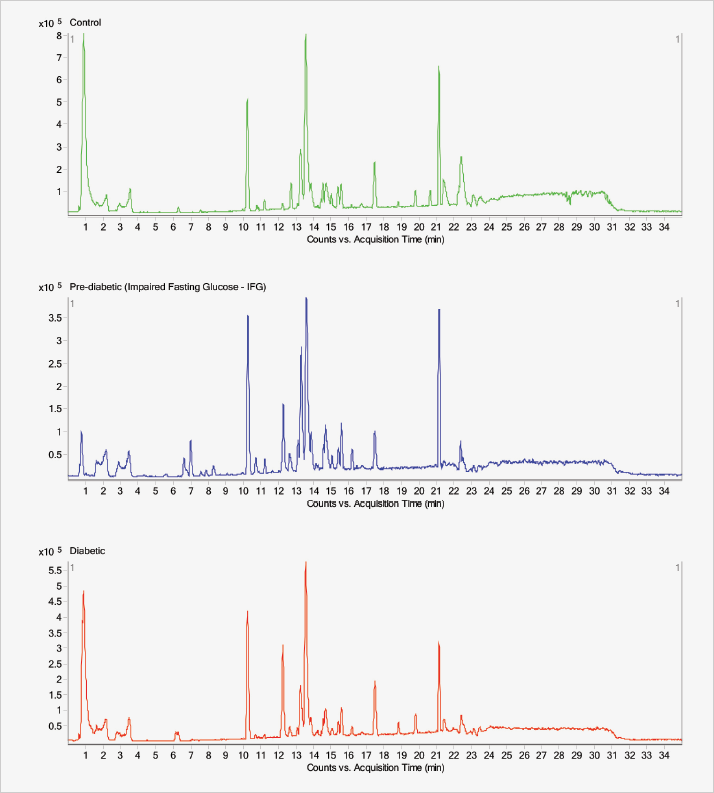
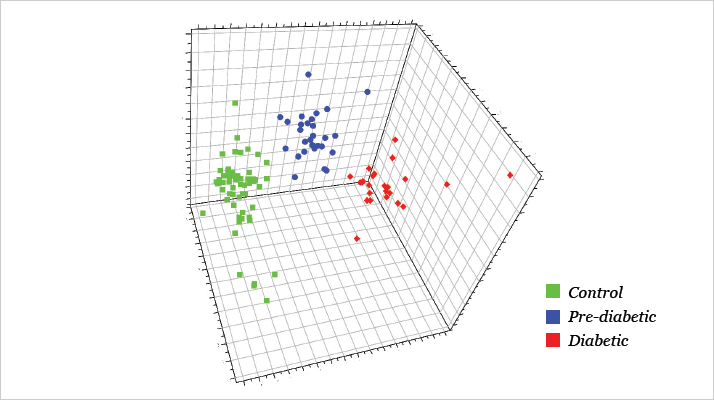
The strength of the study lies in the breadth of metabolites that can be measured and compared between healthy individuals, pre-diabetic subjects, and confirmed type 2 diabetes mellitus patients. The group obtained a large amount of spectral data from these three cohorts and used multivariate analysis (OPLS-DA) to observe three distinct clusters, identifying further metabolites that were markedly different between them using the “variable importance in the projection” values. But Ong is already looking to build on the findings. “One main limitation was the small number of pre-diabetic subjects (24 out of the total 111 serum samples assayed). We are extending this to a larger cohort and also want to look into the temporal changes of the disease biomarkers,” he explains. Though Ong’s group has already studied metabolite profiles of other diseases, such as asthma and cancer, this is the first time that they have included a non-clinic-based, community component – and the findings were not entirely expected. “The extensive metabolite shifts among the pre-diabetic subjects was certainly a surprise,” he says (see Figure 1 & 2). “It suggests that subtle pathophysiological changes have already taken place in these subjects and that our integrated approach can be used for early detection of diabetes, which is of public significance.” Regarding insights into the disease mechanism, Ong says that, “Our overall findings suggest that metabolic interplay between a number of pathways is associated with the development of diabetes.” RW
Samples are assayed in parallel using GC-MS and LC-MS.
Systems:
Agilent 6890 GC system equipped with a 7683 autosampler and HP-5MSI fused-silica capillary column.
Agilent 1200 HPLC with an Agilent rapid resolution HT zorbax SB-C18 column (2.1 × 50 mm, 1.8µm).
Agilent 6410 Triple Quad mass spectrometer, managed by a MassHunter workstation.
Data Analysis:
Spectral data were analyzed using orthogonal projection to latent structures discriminant analysis (OPLS-DA; program: SIMCA-P+ 11) to model predictors (variables/molecular ions) to responses (disease progression).
The prevalence of type 2 diabetes mellitus (T2DM) is on a rampant rise across the globe, making it a critical area of study for metabolomics and biomarker discovery. The bad news is that the disease results from a complex interplay of genetic, metabolic, and environmental factors, complicating analysis. The good news is that progress is being made. Last month, we covered the molecular signatures of diabetic wound healing (1). Here, Choon Nam Ong, director of the Environmental Research Institute at the National University of Singapore, describes his group’s recent research (2).
“The aim of our diabetes metabolite study was to investigate the potential of a metabolomics approach for the early detection of T2DM, even before the occurrence of hyperglycemia,” Ong explains. His group’s metabolomic platform technology allows assessment of a wide spectrum of metabolites, including fatty acids, carbohydrates, and amino acids, that are closely involved in cellular physiology, structure, signaling, and disease onset. “Hopefully, this will offer better insight into the biological mechanisms of the early stages of metabolic disorders,” he says. The approach combines two chromatographic techniques (see sidebar, “The Experiment”) to cover as fully as possible the numerous metabolic pathways likely to be affected. Ong explains: “The two techniques offer different capabilities for measuring a wide range of major biomolecules. For example, carbohydrates, amino acids and a large spectrum of fatty acids are detected using GC-MS, whereas many larger, less volatile molecules, such as sphingolipids and a wide range of phospholipids, are measured using LC-MS.”


References
- theanalyticalscientist.com/issues/0613/201
- F. Xu et al., “Metabolic Signature Shift in Type 2 Diabetes Mellitus Revealed by Mass Spectrometry-based Metabolomics,” J. Clin. Endocrinol. Metab 98 (6) E1060-E1065 (2013).


