Jim Watson, co-discoverer of the structure of DNA and one of the driving forces behind the Human Genome Project, recently said (1), “If I was starting a PhD today, I would do it in metabolomics.” What is exciting to Watson – and to all of us in metabolomics – is that the field is starting to move beyond simply identifying differences between control and treated/disease samples to mapping out pathways and the ways in which they change in response to the treatment or disease.
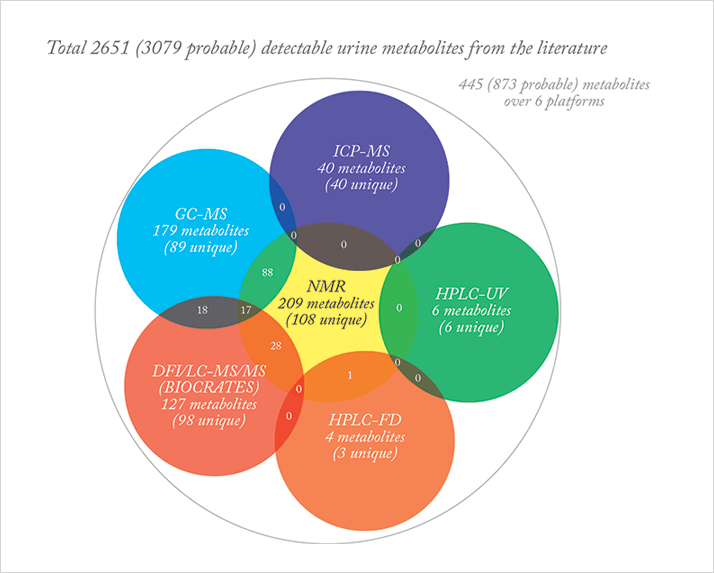
Let’s track the development of the field. The current schema for metabolome investigations began around 2000, although the concept of targeted metabolomics has earlier origins (2). Initiation of the field is generally credited to Robinson and Pauling in 1971 (3) but the term was only coined in 1998 by Oliver et al. (4). Fourier transform infrared spectroscopy (FTIR) was used in that paper, while the first published use of single quadrupole GC-MS was in the field of plant metabolomics in 2000 (5); this work led to the development of GC-MS-based mass spectral libraries, and the Golm metabolome database (6, 7). Whilst this early research in plants was termed metabolomics, Nicholson and colleagues (8) led a parallel approach in whole organisms, which they termed metabonomics. Today these approaches have completely converged. Shortly after these initiatives began, the Human Metabolome Project emerged, led by David Wishart at the University of Alberta. It resulted in the development of the Human Metabolome Database (HMDB), a freely accessible web resource (9), which has recently been upgraded to version 3.0 (10) and now contains more than 40,000 annotated metabolite entries. Since 2007, Wishart and coworkers have quantitatively measured several metabolomes (11-14), including that of cerebral spinal fluid, human serum, human urine and bovine ruminal fluid. In determining these biofluid metabolomes, they first mined the literature to determine the number of compounds that could be expected to be present. The experimental data subsequently used multiple instrumental platforms to maximize metabolome coverage, with quantitative data being established for the majority of metabolites. All of the experimental biofluid metabolome studies detected and identified fewer compounds than literature mining, but they also revealed compounds that had not previously been reported, as well as reporting concentration ranges for the metabolites. The most recent study, on the human urine metabolome, included the measurement of inorganic ions using ICP-MS and utilized BIOCRATES kits for targeted analysis.
The need for multiple platform analysis to maximize metabolome coverage is well known, as illustrated in Figure 1 (from Ref. 13). Equivalent conclusions have been drawn from non-human metabolome studies (15,16). The strengths and weaknesses of each instrumental platform for different biofluid types have been highlighted through these multiplatform studies.
Ever since the life science community began to drive developments in separation science and mass spectrometry, the mantra has been “better separations, faster”. Routine use of mass analyzers for metabolite “separation” following partial or minimal chromatographic separation is now common practice. This desire to undertake minimal sample preparation results in routine analysis of samples that would have previously been considered “too dirty” for mass spectrometry analysis; however, the need for metabolite limits of detection comparable to those achieved after extensive sample preparation remains, which places substantial demands on the chromatographic instrument, the mass spectrometer source and the initial ion optics. As a result, instrument manufacturers have invested significantly in research and development of source design to make them more robust, under the constraint of maximizing sensitivity. The techniques that are routinely used, together with emerging techniques, are shown in Figure 2.
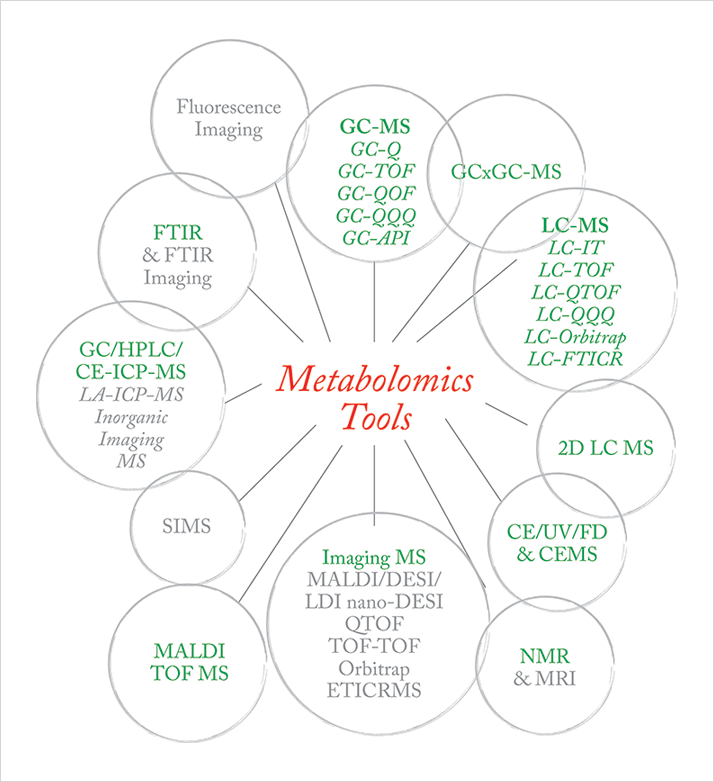
The ideal metabolomics consortium would have access to all of these technologies, and a clear approach that plays to the strengths of each configuration for the sample types under study. Here, rather than address each chromatography and MS configuration, we focus on the strengths and shortcomings of each mass analyzer.
Single Quadrupole Instruments The period from 2000 onwards has seen substantial developments in instrument and software performance. For GC-MS, single quadrupole systems can now operate at more than 15 scans per second, matching fast oven ramping to improve sample throughput, compared with 2-3 scans per second in 2000. In addition to faster scan rates, the instruments now have substantially improved limits of detection, even in full-scan mode. However, one must be cognizant of the type of samples being analyzed and the impact of these on the ability to achieve higher throughput analysis. For instance, plants have many different sugars, with very similar mass spectra, which dictates that they must be chromatographically resolved, reducing sample throughput compared with, for example, a plasma sample. Time of Flight Instrument Perhaps the most consistent developments in metabolomic analysis have come from Q-TOF mass analyzer instruments, even though the focus has been on HPLC- or UPLC-based systems. Mass accuracy, mass resolution, scan speed and dynamic range of mass analyzers have all improved significantly over the last decade, to the extent that this can be considered the age of the TOF. TOF and hybrid TOF instruments have been widely used. Their key benefit is broad metabolome coverage; however, only some of the most recent instruments are capable of polarity switching and data-dependent MS/MS, and MS/MS without loss of mass resolution and mass accuracy is limited to the very newest instruments. Accurate isotopic patterns are now achievable with most instruments, which, together with 1 ppm mass accuracy, offers the ability to determine unambiguous stoichiometry up to 500 amu. This killer combination in the latest generation instruments, under 1 ppm mass accuracy and over 50,000 mass resolution, delivers MS/MS without loss of mass accuracy or mass resolution and accurate isotope patterns; it represents substantial increased capability for untargeted metabolomics.
However, post-processing can be extensive with the latest generation instruments. Whilst cumbersome, it is possible to manually curate GC-MS single quadrupole untargeted data (where, typically, more than 400 compounds can be resolved) but this is simply not viable for QTOF data, where it is routine to resolve several thousand features. Software tools are needed to undertake the first pass and subsequent curation steps, and to identify “problem” metabolites in each sample, as well as facilitating visualization of the metabolite peak. Previously, third party software was used, but it is now being incorporated into vendor software. In addition, the software needs to facilitate the removal of features that are background to the system and artifacts from sample preparation methodologies Until very recently, dedicated GC-TOF instruments have largely been nominal mass instruments with fast scanning capability. Dedicated “high” resolution GC-QTOF MS instruments have only recently become available, and they currently do not have the capabilities of the latest generation LC-QTOF MS systems. The GC-QTOF instruments are limited in mass resolution to around 12,500 and in mass accuracy to 5 ppm. In the low mass range where they operate, there is a clear need for capability improvement. for capability improvement.
GCxGC TOF MS We discuss GCxGC separately as it is a technique that promises a great deal but has not been fully utilized by the metabolomics community because of data analysis complexity and the difficulty in building automated pipelines. Typically, switching from a GC-MS single quadrupole system to a GCxGC TOF MS system results in detection of 2-3 times more metabolites. GCxGC instruments are significantly more expensive to purchase than GC-MS single quadrupole systems, while requirements for liquid nitrogen cryo-cooling significantly add to operating costs, which has been a factor in the slower uptake. The cost issue has been partly addressed by consumable-free configurations, but these have some limitations with metabolites of very high volatility. Furthermore, the data format used for these instruments was not readily imported into third party software packages until recently. Most likely, the full capability for metabolomics will be realized as the next generation of GCxGC systems with sub part per million (ppm) accurate mass become available in 2014. Triple Quadrupole Instruments Triple quadrupole (QQQ) instruments have traditionally been considered only for analysis based on selected reaction monitoring (SRM) or multiple reaction monitoring (MRM) as the sensitivity for full-scan was inferior to single quadrupole instruments. However, latest generation instruments have excellent full-scan sensitivity, only surpassed by the latest generation single quadrupole instruments. When MRMs are established, QQQ-based instruments are capable of metabolite MRM analysis of far more than 500 compounds in a single run. This offers the potential for development of large targeted analysis workflows, referred to as a ‘targeted untargeted’ approach. Through the development of metabolite MRM atlas platforms in parallel with the peptide SRM atlas (www.srmatlas.org), it will be possible to select pathways to be analyzed by choosing the appropriate metabolites. This will be a significant step in the development of quantitative metabolomics, and help establish metabolomics as the new clinical chemistry.
Fourier Transform (FT)MS FT instruments are now considered to be the gold standard for mass spectrometry, as sector instruments are gradually disappearing. FT instruments command a significant price premium but have always been considered to provide ultimate performance. FT-ion cyclotron resonance (ICR)-MS instruments have undergone significant developments in the last two years, with the switch from the solution to the absorption mode of operation. This instantly doubled the instrument’s resolution and, coupled with the development of the ParaCell, provides resolution up to 10,000,000. With a number of source options (electrospray ionization (ESI), nano spray ESI, atmospheric pressure chemical ionization (APCI), atmospheric pressure photo ionization (APPI), GC/API and matrix-assisted laser desorption/ionization (MALDI)), and MS imaging, FT-ICR-MS has become a very flexible metabolomics solution when used in a 7 Tesla magnet configuration. The current generation of Orbitrap analyzers – the Orbitrap Fusion Tribrid – combines quadrupole, ion trap, and Orbitrap technology, and has a mass resolution of 450,000, with under 1 ppm mass accuracy, up to15 MS/MS scans per second, and with the options of ESI, nano spray ESI, APCI, and APPI sources.
Capillary electrophoresis-MS CE-MS has recently re-emerged as sheathless MS interfaces become commercially available. With sheathless interfaces, the dilution effect of the sheath liquid is removed and the resulting MS signals are approximately two orders of magnitude higher. This has significantly improved metabolome coverage and allows users to take advantage of the anion-neutral-cation coverage within a single metabolomics analysis. CE has always been considered a very high-resolution chromatographic technique and requires the scanning speed of a QTOF mass analyzer to cope with the chromatographic resolving power. NMR Nuclear magnetic resonance (NMR) is suited to urine analysis because it offers the opportunity to simply balance pH and analyze – no further sample preparation is required. Deconvolution is used to determine the metabolites that are present, and their levels. The strengths of NMR are its ability to identify compounds with great confidence and the fact that it is a quantitative technique. However, it has an inferior detection limit compared with mass spectrometry. This inability of NMR to detect and differentiate the changes in low-level metabolites that mass spectrometry techniques routinely monitor is a considerable drawback for the metabolomics community. Despite this fact, the recent human urine NMR metabolome data from the Wishart group (13) demonstrates the ability of NMR to monitor and quantify 200-plus metabolites in urine samples. And recent developments in NMR magnet and probe technology have significantly improved the temporal stability of chemical shift, with claims of stability lasting several years.
Folded Flight Path Folded Flight Path (FFP) mass analyzer instruments have recently been introduced to the mass spectrometry market. They offer high mass resolution (of up to 50,000), mass accuracy of less than 1 ppm, accurate isotope patterns and fast scanning rates (up to 200 scans per second). Due to be released with GCxGC capability later this year, FFP instruments will be valuable complementary additions to the metabolomics toolbox. Instruments using this technology are currently undergoing evaluation in the hands of the metabolomics community.
The Data Bottleneck Data analysis and informatics processes, critical sections in the metabolomic workflow, must now be considered to be the bottleneck in metabolomics (taking over from sample preparation, the traditional analytical chemistry bottleneck). Data processing, informatics and bioinformatics each contribute to the problem and these days successful metabolomic studies devote at least half of the total project time to these issues. One of the key workflow processes is the curation of data prior to any statistical treatment, which specifically involves deconvolution, integration, and internal standard correction and normalization. Normal variation in metabolites can result in levels for individual samples low enough that the software deconvolution and integration algorithms do not detect certain metabolites in some samples. There are two camps in the data analysis debate with respect to the handling of missing values for metabolites in data sets when dealing with untargeted metabolomics studies. One camp advocates for, and the other against, the replacement of missing values with weighted averages of values from the other samples for that metabolite using an automated pipeline. This approach is very much at odds with the traditional targeted analytical chemistry approach and will continue to be a point of disagreement between biologists, who require an automated pipeline, and traditional analytical chemists.
MS Imaging All early studies were “bulk metabolomics”, in which a tissue sample was extracted and the composition of the extracted metabolites was representative of the bulk compositional information. In contrast, Richard Caprioli and coworkers have pioneered the development of MS imaging with an initial focus on proteins and peptides. This has been expanded to include lipids and metabolites, and there is an enormous development effort going into this approach, which will provide specific tissue location data. Quantitative Metabolomics Untargeted metabolomics studies are primarily semi-quantitative. The cost of quantitative untargeted metabolomic studies can be prohibitive, as most techniques will detect ≥ 400 compounds. Stable isotope dilution analysis requires labeled standards for each metabolite and even at a cost of just $1 per metabolite, costs mount up quickly. A more affordable approach utilizes a labeled metabolite for each class of metabolite. The standard addition approach requires that every sample has up to five analysis runs, adding a significant time and cost burden to studies.
Clinical Chemistry Clinical chemistry analysis compares the levels of metabolites in patient samples with the normal population range, and typically each test looks at just 2-3 metabolites, which are used as biomarkers associated with a disease. However, metabolomics has the capability to measure biomarkers associated with not just a single disease but those from many diseases simultaneously. Furthermore, broad metabolomic coverage offers the opportunity to study disease progression in greater detail, making the prospect of personalized medicine a reality.
In order of priority, some of the major challenges that face the metabolomics community, and, therefore, offer potential opportunities are:
- Compound Identification: the confident assignment of metabolites is critical to advancing metabolomics.
- Standards: for many metabolites standards are difficult to obtain.
- Pathway Mapping: the real promise of metabolomics is in establishing which biochemical pathways are modified in response to a disease in humans or animal models, or to biotic and abiotic stress in plants. This provides the ability to monitor disease progression and the response to treatment.
- Large Sample Sets: studies with cohorts of several thousand will become the norm; there is a clear need to establish the ability to analyze these large sample sets without instrument bias.
- Bioinformatics: as outlined earlier.
In addition, metabolomics as a field needs to make advances in the following areas:
- Metabolite MRM libraries
- Organ- and organism-specific mapped pathways, using an agreed format
- Integrated targeted and untargeted methodologies
- Upward integration of metabolomics with lipidomics and proteomics
- Data visualization tools which provide the ability to walk through pathways and between pathways with links to lipid and protein switches or shunts.
Finally, I note that a great deal of scientific literature appears to be invisible to the research community unless it is electronically accessible – certain research projects are therefore in danger of missing critical information or repeating experiments that have already been undertaken. We should not re-invent the wheel. Robert Trengove is Director of the Separation Science and Metabolomics Laboratory, Murdoch University, Perth, Australia.
Newsletters
Receive the latest analytical science news, personalities, education, and career development – weekly to your inbox.

References
- James Watson: “Glycolosis, cancer and metabolomics”, video: tas.txp.to/0114/Watson N. L. Kuehnbaum and P. Britz-McKibbin, “New advances in separation science for metabolomics: resolving chemical diversity in a post-genomic era”, Chem. Rev. 113, 2437−246 (2013). L. Pauling et al, “Quantitative analysis of urine vapor and breath by gas-liquid partition chromatography”, Proc. Nat. Acad. Sci. USA, 68 (10) 2374-2376 (1971) S. G. Oliver et al., “Systematic functional analysis of the yeast genome”, Trends Biotechnol. 16, 73-378 (1998). O. Fiehn et al., “Metabolite profiling for plant functional genomics”, Nat. Biotechnol. 18, 1157 (2000). N. Schauer et al., “GC–MS libraries for the rapid identification of metabolites in complex biological samples”, FEBS Letters 579 1332–1337 (2005) J. Kopka et al., “GMD@CSB.DB: the Golm Metabolome Database”, Bioinformatics 21, 1625-1638 (2005) J. K. Nicholson, J.C. Lindon, and E. Holmes, “‘Metabonomics’: understanding the metabolic responses of living systems to pathophysiological stimuli via multivariate statistical analysis of biological NMR spectroscopic data”, Xenobiotica 29 (11) 1181-1189 (1999). D. S. Wishart et al., “HMDB: the Human Metabolome Database”, Nucleic Acids Research, 35, Database Issue D521–D526 (2007). D. S. Wishart et al., “HMDB 3.0—The Human Metabolome Database in 2013”, Nucleic Acids Research, 41, Database Issue D801–D807 (2013). R. Mandal et al., “Multi-platform characterization of the human cerebrospinal fluid metabolome: A comprehensive and quantitative update”, Genome Medicine 4 (38) (2012). DOI:10.1186/gm337 N. Psychogios et al., “The human serum metabolome”, PLoS ONE 6 (2) e16957 (2011). S. Bouatra et al., “The human urine metabolome”, PLOS One 8 (9) e73076 (2013). F. Saleem et al., “The Bovine Ruminal Fluid Metabolome”, Metabolomics 9, 360–378 (2013). F. M. Geier et al., “Cross-Platform Comparison of Caenorhabditis Elegans: Tissue Extraction Strategies for Comprehensive Metabolome Coverage”, Anal. Chem. 83, 3730–3736 (2011). J. M. Buscher et al., “Cross-Platform Comparison of Methods for Quantitative Metabolomics of Primary Metabolism”, Anal. Chem. 81, 2135–2143 (2009).