Hello art lovers! The Analytical Scientist pop-up gallery is back, and this time we're celebrating the MS-inspired magic of our latest artist-in-residence, Luis Schachner.
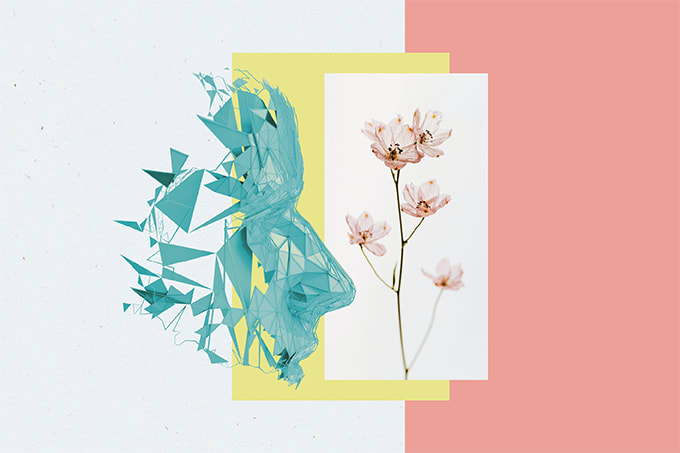
Luis is driven by the myriad ways in which we can interpret and present MS data. As he asks: "At what point does data visualization become art? And at what point can art become a meaningful form of data visualization?" Luis' work blurs the lines between these worlds with imagery that inspires and provokes.
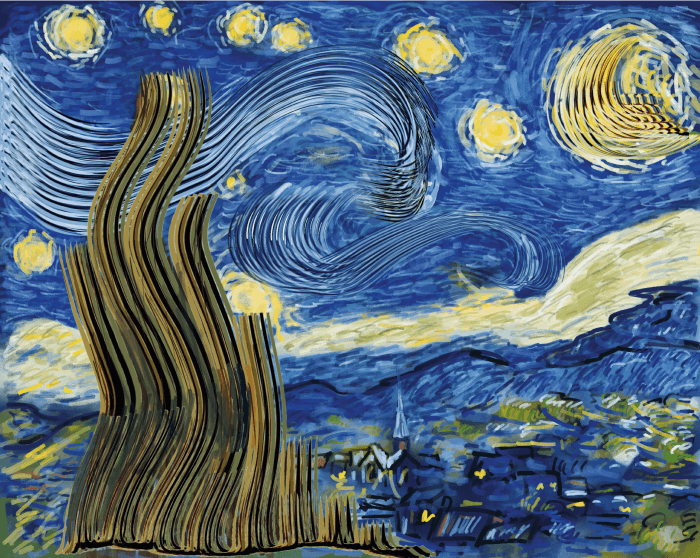
Ever seen a Van Gogh reimagined using the mass spectrum for Prussian blue? What about a manipulated amyloid beta spectrum that explores the loss of self associated with Alzheimer's disease? Now's your chance. Plus, each piece comes with commentary from the artist. Enjoy!
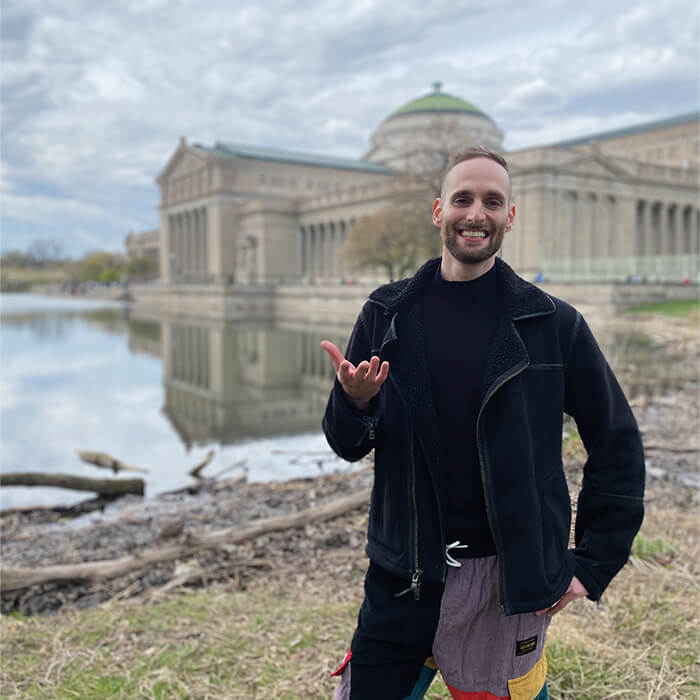
I was born in Venezuela and came to the USA for college, where I was determined to study International Relations and make a positive difference for my home country. But my first encounter with scientific research led me down another path entirely.
I discovered the research world by accident. My summer internship ended unexpectedly during my freshman year and the only job I could find was in an environmental engineering lab. There was something really special about working on the experiments there. I was working with my hands and troubleshooting problems. Everything felt like it was falling into place, and – a few twists and turns later – I found myself doing a PhD in analytical chemistry. I’m completing that PhD right now at Northwestern University near Chicago, Illinois, focusing on the application of MS to structural biology and protein systems.
I was excited by how easy it was to collaborate with others through technology and answer many scientists’ questions about their favorite systems. By my second year, I had over 30 active collaborations across multiple departments. As you can imagine, my PI wasn’t too keen on this, so I had to dial it down a bit. But it felt like I was doing science with friends and I had so much fun, often inviting my collaborators to join me as I analyzed their samples on the instrument. Research felt more meaningful this way.
I only became aware of the “art multiverse” when I attended an art and meditation festival in the American midwest. It was around that time that I had discovered mindfulness and was really enthusiastic about it. But I had this sense of: “I’m present. Now what…?” After meeting all sorts of artists, I had an empowering feeling that, when I was present, I could start flowing with my imagination and create without judgment. I wasn’t conscious of this then – or how I would relate it to science – but that was the beginning of an amazing journey.
That’s a great question, because it’s definitely something that I struggled with as I started my art journey. I would look at the blank canvas and be totally overwhelmed. Overwhelmed then quickly became overthinking – and then my mind would freeze completely. One day a colleague approached me while I was analyzing a spectrum; she said that I could see things in the data that others can’t. I was inspired by what she said. I decided to start with the data, rather than the (intimidating) blank canvas in front me. Extracting and manipulating the data then triggered my inspiration.
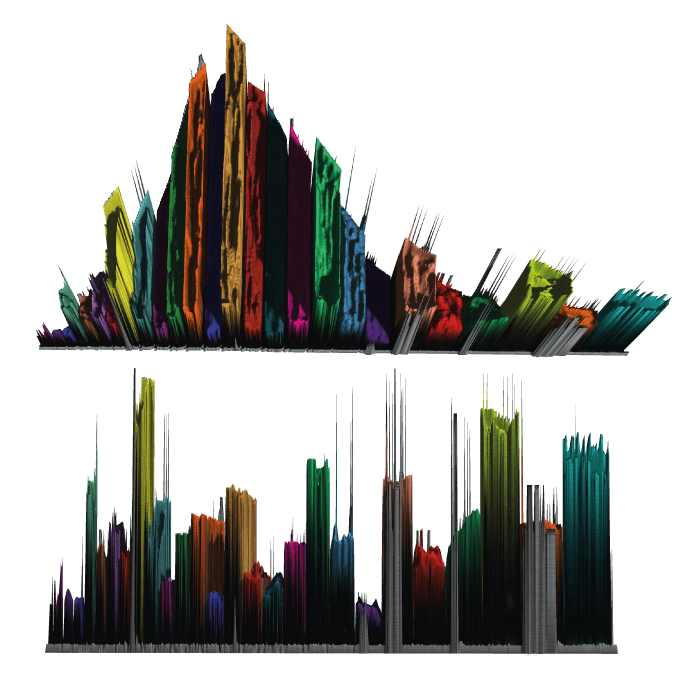
Along the way, I’ve been inspired over and over – by both scientific and artistic discoveries. My vision now is clearer: to play with spectra in subjective ways, and also to create art using increasingly accurate representations of data. Part of this will involve moving my art into three dimensions, which should allow me to create actual shapes that represent the parameters and constraints of the data. I’m learning to code now so that I can do that.
I collaborated with two colleagues, Danté Johnson and Raquel Shortt, who represent the Black community in MS. We became friends at conferences and they loved my art portfolio. By the time Black History Month came around, the three of us were brainstorming a way that we could combine my passion for art with the need for powerful messaging about increasing the number of Black researchers in science. We wanted to start important conversations about representation, diversity, and equity (see April’s Image of the Month: Portrait of a Black Researcher).
One of the key ideas we had was using spectra for the hair. I had used spectra to create hair in my previous works; for example, in my drawing of Ronald McDonald using high-density lipoprotein spectra. But that’s a tale for another time. Beautiful afros and wonderful, thick hair are really prominent in Black culture, so we opted to draw a Black woman with hair comprising GC-MS traces for melanin. I think the result speaks for itself.
We’re now working on other projects with the same aim, including some doodles of Henrietta Lacks, a Black woman whose immortalized cervical cancer cells were taken without consent and are still used in medical laboratories around the world to this day.
I’m working on a couple of others right now – one for Women’s History Month, and another for trans representation. Then there are a handful of general celebrations in the field, too. The other day I saw some scientists post about an MS application that allowed them to differentiate between grain-fed and grass-fed beef. I’m not exactly sure why, but I found this very exciting (in spite of the fact that I’m in the process of becoming vegan). I immediately dropped everything I was doing and started drawing a steak. I even used their mass spectra to mimic the marbling of the meat. Once I finished, I sent the drawing to the researchers in question.
It’s great because I love to share my excitement with the people doing this great work. Together, we create this continuous cycle of creativity and joy. And that’s a wonderful thing, because the scientific community – as supportive as it can be – can tend to take things very seriously. I’m very curious, and I love to share that curiosity with people who share my passion for research.
They love it. It’s quite special to connect with a student who’s really excited about their work, so when I up the ante by appearing out of nowhere with a drawing of a steak in the context of their research, I think they find it gratifying. And it’s a lovely experience for me, too. I love connecting with enthusiastic researchers and grad students. It’s another amazing example of how we can create and maintain a community through our appreciation for MS.
I guess that depends on how long it takes to make a given drawing as stunning as it needs to be. The steak took me 30 minutes, but that was a quick one because I was really excited about the meat. In any case, the first step in my process is to study the raw data, noting the thoughts and images that come to mind as I do so.
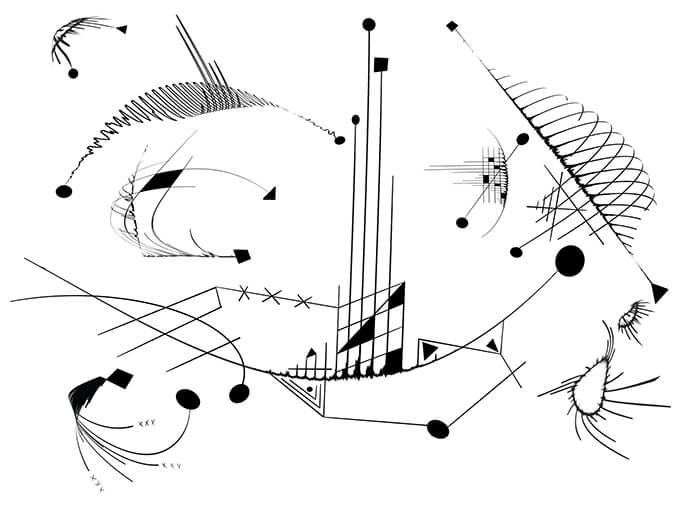
That process is apparent in another piece I made for another scientist on Twitter. The scientist in question had commented on one of my posts to say that she really wanted her own drawing. Once I noticed that she was a fellow analytical chemist, I did what any budding artist would do: I looked at the spectra from her own microplastics research and used them to draw the first image that came to mind – a fish skeleton. Once I had that clear vision, it took me around 45 minutes to bring the drawing to life.
The melanin piece that I worked on with Danté and Raquel took me around two hours after I discovered a neat trick to transform the spectral lines into curls for the afro. With an additional week or so of minor edits and new iterations with my collaborators, it was ready to share. One thing I am learning on my artistic journey is to let go of my perfectionism!
Well, I should start by saying that I don’t have a particularly artistic background. I empowered myself to learn (putting in lots of practice on my iPad) over the couple of years following the art festival I mentioned earlier. As I started to wrap up my PhD projects and began writing articles for publication, I started referring to my scientific figures as art. I would even joke with others that, to me, a mass spectrometer was an instrument with which I was making molecular art in the form of spectra!
During this process, I also became slowly more conscious of this strange boundary between data visualization in science and art. At times, I found this boundary became much more blurred than we might first imagine. Consider it for yourself… At what point does data visualization become art? And at what point can art become a form of meaningful data representation?
I found myself existing somewhere between these questions. Plus, MS is a very special technique – not only because of the massive community surrounding it, but also because it brings together disparate disciplines around the study of atoms and molecules. At the annual ASMS meeting, you’ll see biologists, geologists and food chemists connecting around MS. Maybe this interface is the reason that I felt such kinship with the data it produced. I didn’t want to portray that data accurately at first, mind you. I just wanted to play with the spectra!
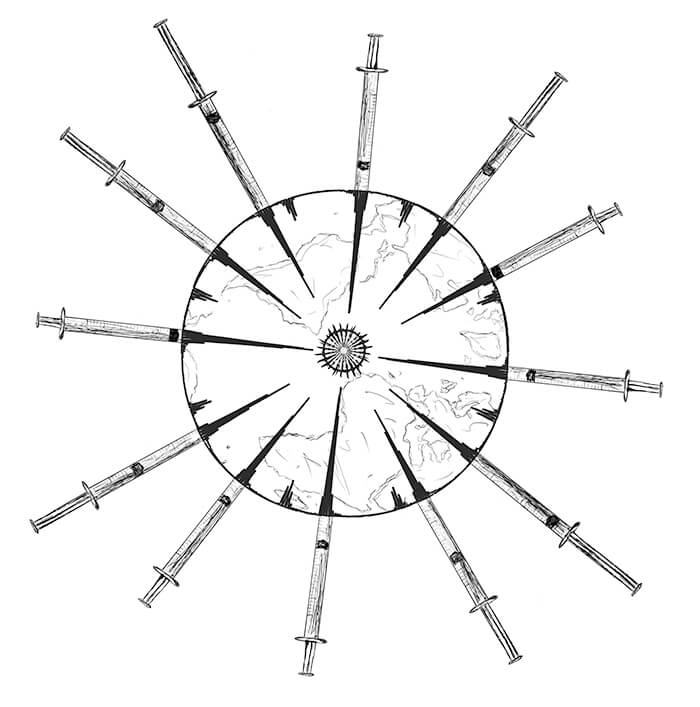
Absolutely. Analytical science is a great medium for my art. Why? Well, because it’s analytical science! There’s not much out there that celebrates the amazing data we gather. Don’t get me wrong; we are always talking about what our data mean, but we don’t spend time just looking at and admiring our data. In a way, the mass spectrometer records the spectral essence of molecules, and it often produces unique patterns and experiences. One of the main drivers behind my love for MS is the shapes and parallel lines that it produces… I love parallel lines! Moreover, by changing the conditions inside the instrument, we can interact with the ions directly. The mass spectrometer thus transduces our will into the molecular universe; the whole process is phenomenal.
I'm generally happy with all of it. I’m really proud of the melanin drawing and how it was received by the community, and also my progress with 3D modeling and animation – the possibilities are endless! The nucleosome is my favorite subject at the moment. I studied it extensively during my PhD, and I’m playing with lots of ways to depict it in 3D space using all of the structural data available. I even made a drawing of a sea urchin using the 601 DNA sequence, which is vital for nucleosome biochemistry and was discovered in sea urchins. So many little discoveries have made my research possible, and I want to honor them as I go.
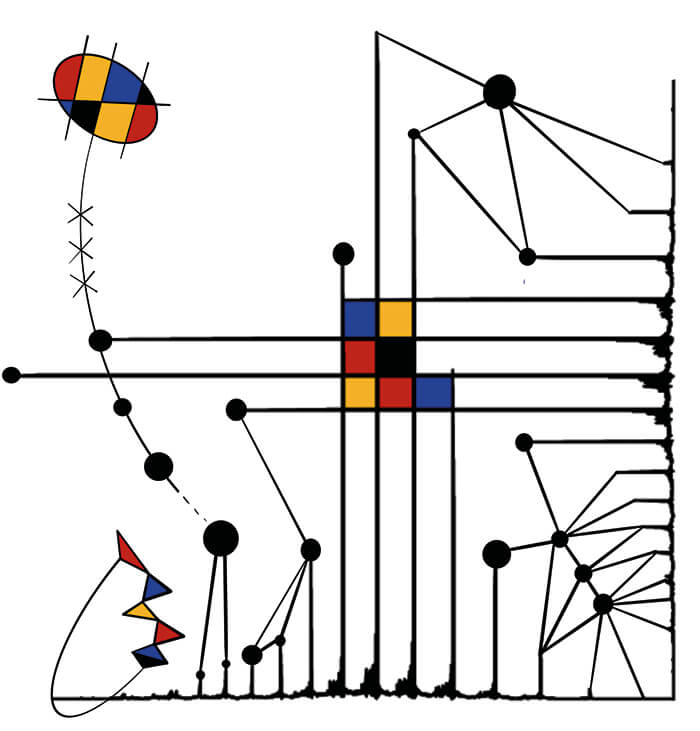
I have also been interested in learning about the role of analytical chemistry in the conservation of fine art. For example, Prussian blue is a deep blue pigment made of iron-cyanide crystals that revolutionized the art world in the 19th century. At the time, blue paint degraded easily and did not have much depth. I used the mass spectra of Prussian blue to draw my interpretations of paintings that first made use of it like “The Great Wave off Kanagawa” by Hokusai, and others by Van Gogh (see below!) and Hiroshige, to commemorate the ways in which MS is contributing to art around the world.
I’m actually writing (or rather illustrating?) a picture book for scientists based on different data collections – but I’m also planning to add an element of augmented reality to it. The idea is that a scientist (or non-scientist) would have a physical book with my drawings and the scientific and human stories behind them. But then they would also be able to scan the images with their phone to bring a 3D version to life so that they can interact with the data much more dynamically. Progress is good so far; I’m getting close to having a full version to share with the American Society for Mass Spectrometry soon. I think they’ll like it.
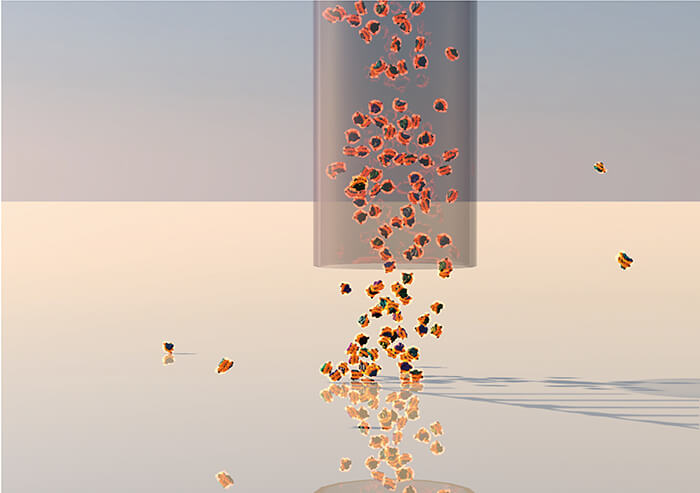
I also have a physical gallery exhibit in the works. I’m preparing a showing based on molecular and spectral perspectives on plastic. The aim is to expose the meaning of plastic, from its monomer building blocks all the way up to the complex structures that they come together to form. I’m planning to have 3D-printed sculptures, augmented reality exhibits, canvas… all to show that plastic allows us to turn our dreams and visions into reality thanks to its malleable and versatile nature. I’m also collaborating with an artist who specializes in gamified, interactive experiences. For this, we are building an augmented reality game around the exhibit, where the audience acts like PETase – a bacterial enzyme that “eats” plastic – to clean up plastic litter in a virtual scene using their phone. We want to place the exhibit in the context of the human experience, but also create a sense that “plastic” is an idea and that there are many ways to engage with it.
I also prepared a set of drawings for the 420 holiday. For the uninitiated, this is an annual celebration of all things cannabis on April 20. My aim here is to showcase the amazing MS research happening in the cannabis space right now (for example, in quality control) to produce some cool pieces that can communicate the importance of this research. I want to dispel stigma around this research area and normalize conversations about cannabis.
With the current expansion in digital art and animation, there are many opportunities for science storytelling to become more artistic in structural ways. Imagine science conferences that also hold a space for a curated exhibit of the participating scientists’ art. Or a journal that publishes great science but with a strong emphasis on art, animations and beautiful figures.
Artists and scientists share lots of great qualities. I envision the two worlds coming together in playful and productive ways to creatively address the shared needs of our communities.
Love what you see? Why not check out Luis' Instagram (@luis.schachner) and Twitter (@ArtSpectrometry) pages!
Newsletters
Receive the latest analytical science news, personalities, education, and career development – weekly to your inbox.

References
- CG Gonzales, et al., "Latent-period stool proteomic assay of multiple sclerosis model indicates protective capacity of host-expressed protease inhibitors," Sci Rep, 9, 12460 (2019). DOI: 10.1038/s41598-019-48495-5