Pyrolysis-gas chromatography-mass spectrometry (Py-GC-MS) is widely used for polymer characterization. The precisely controlled pyrolysis heating step provides informative and specific products that can be separated and identified by GC-MS to estimate the polymeric composition and structure. However, these profiles are sometimes too complex to be characterized properly by conventional GC, leading to potential loss of information. Comprehensive two-dimensional gas chromatography (GC×GC) provides enhanced resolving power and peak capacity by combining two different separation mechanisms in one analysis. This allows for more detailed separations and more complete characterization of complex matrices. Here we demonstrated the Py-GC-MS and Py-GC×GC-MS profiles of polyethylene (PE) to prove the advantages arising from coupling pyrolysis and GC×GC.
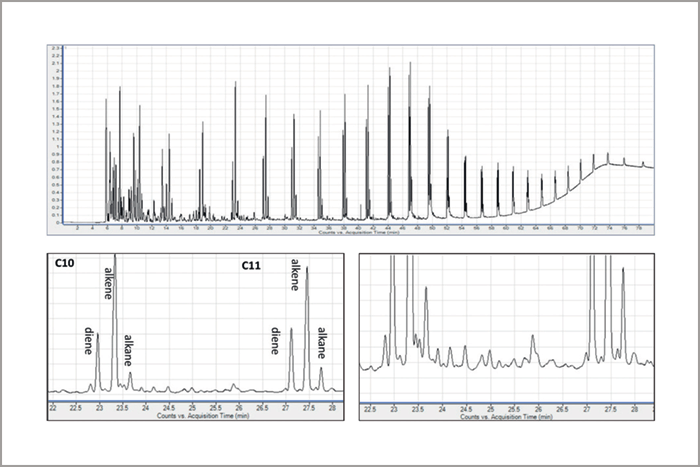 Figure 1. Py-GC-MS chromatogram of PE. The zoom-ins show a detail of the profile and an example of a complex area.
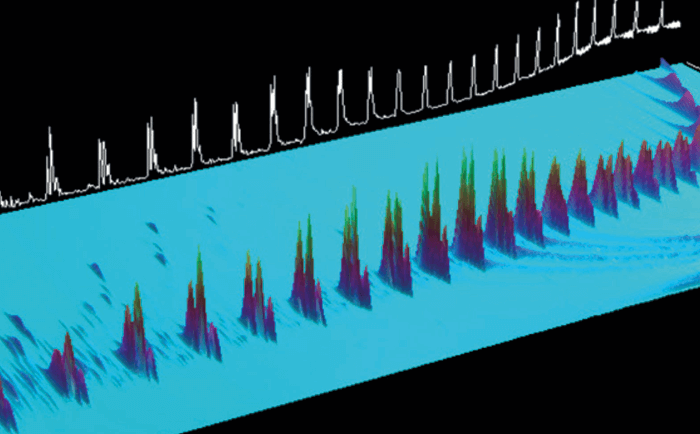 Figure 2. 3D view of the py-GC×GC-MS chromatogram of PE.
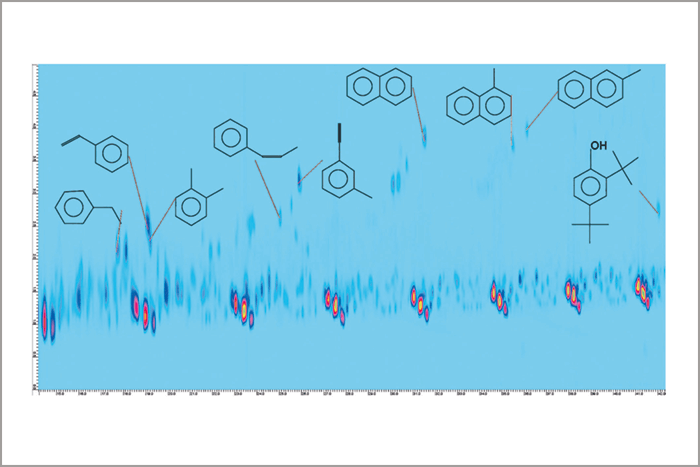 Figure 3. Py-GC×GC-MS chromatogram of PE.
Fig. 1 shows the GC-MS chromatogram of a PE sample subject to pyrolysis at 750°C through a CDS Pyroprobe and separated on a non-polar column. The characteristic PE pyrolysis profile shows a repeating unit of triplets of paraffins (diene-alkene-alkane) for every carbon number. Between these major peaks, there are a number of smaller, unresolved peaks commonly identified as branched paraffins. The two-dimensional separation of the same pyrolysis profile is shown in Fig. 2. The second dimension separation based on polarity grants additional composition information. Several peaks are visible between the triplets, providing a better idea of the number of branched paraffins present. Additionally, there are a number of polar compounds more retained on the second dimension (Fig. 3). These analytes are not visible at all in the GC-MS analysis due to their small abundance and the co-elution with the aliphatic components, like in the case of naphthalene and C12 triplet. In the 2D plot they are fully separated and show clean MS spectra that allow for easy identification. In conclusion, Py-GC-MS analysis of polyethylene shows a characteristic pattern of paraffin triplets for every carbon number. However, separation is not sufficient to unravel the sample complexity. Characterization obtained by coupling pyrolysis with GC×GC provides more information. Several aromatic compounds are identified in the 2D pyrogram of polyethylene which are not detected in the mono-dimensional separation.
>> Download the full Application Note as PDF
Newsletters
Receive the latest pathologist news, personalities, education, and career development – weekly to your inbox.