Towards Tsunami-Resistant Chemometrics
Despite a fall from grace in recent years, chemometrics has a key role to play in the interpretation of mega-variate datasets. Here, I diagnose the problems that the field currently faces and propose that developing a theory of chemometrics offers a way forward.
The ever-increasing volume of information generated by hyphenated analytical platforms requires science – and scientists – to adapt or be drowned by the deluge of data. One development, actually a new science paradigm, that puts the analytical sciences in the driving seat of scientific research is so-called ‘data driven’ research: increasingly, analytical measurements are performed to generate hypotheses rather than to confirm them. However, to live up to the promise of data-driven research, powerful chemometric data analysis is essential and, at the moment, this is sadly lacking.

In an era where tsunamis of data are flooding the scientific world, it is painfully apparent that the development of data analysis methods has not kept pace. The standard workhorses of chemometrics, such as principal component analysis (PCA), which were designed to cope with multivariate data, are cracking at the seams under the pressure of mega-variate datasets originating from comprehensive molecular profiling, biobank samples, sensor technologies and so on. Chemometricians are not coming up with sensible answers to questions about these kinds of data.
Another striking shortcoming of chemometric data analysis is the lack of underlying generic strategies for workflow. In practice, each individual dataset currently requires its own analysis research project to cope with its peculiarities, which originate in measurement methodologies as well as in sample or data types.
These issues have brought us to an unprecedented state of affairs. Chemometrics, which has always been in demand for the study of larger and more complex datasets, is now inadequate and underappreciated, floundering in the wake of the data tsunamis. It is high time that action was taken to keep the field afloat. Here, I analyze and diagnose the situation, and then propose a plan of action.
Diagnosis
Let’s first note that chemometricians are not the only ones struggling with the data tsunami. Computer scientists, too, have ‘big data’ problems and are working furiously on solutions for managing and sharing large amounts of scientific data while maintaining data integrity. We must follow their efforts closely.
On analyzing the current state of chemometrics, a few immediate conclusions can be drawn. First, explorative analysis must be upgraded. We have always taken for granted the explorative power of PCA, our basic tool, but it is just not up to the task of exploring mega-variate datasets.
Second, we cannot assume linearity, the very assumption that enabled us to develop the powerful and robust methods to analyze moderately complex nonlinear behavior. While the assumption remains a valid approach to ‘classical’ multivariate datasets, whether it applies to mega-variate data over broad scales is, at best, an open question.
Third, there is an urgent need for new methods and strategies that combine data from different sources; an example would be the association of images and molecular profiles measured over different timescales. Data from a whole host of disparate platforms, including unstructured data, such as text, need to be integrated.
Fourth, we need to develop a ‘chemometric theory’. This is urgent. Chemometrics evolved, for various reasons, as one hundred percent empirical science so, unlike (applied) statistics we don’t have an underlying theory to fall back on. However, we now need one, or at the very least a general strategy, to make chemometrics tsunami-resistant.
Explorative analysis
The first step of data analysis is explorative analysis. If we can’t reveal the essence of the data in a simple plot and access easy tools to explore further ideas, we can forget about the generation of new hypotheses. PCA is the jack-of-all-trades of chemometrics for explorative analysis. Its basic principle is simple and powerful: that which causes the largest variation in a dataset is most relevant, and identifying it reveals the essence of the data.
With mega-variate data, however, this principle stumbles. Measurements are now often performed to search for the so-called ‘needle in the hay stack’. In biomarker discovery, for instance, the principle of ‘largest variance is most important’ has no value; rather, most of the variation is due to uninteresting causes and an explorative PCA plot reveals nothing of value, as can be seen in Figure 1a.
To extract the needle in the haystack, projection techniques that use alternative criteria, such as independent component analysis (ICA), have been explored (for an overview, see Reference 1). While sometimes successful, these criteria are artificial and often computationally-intensive, and have never truly taken off. A recent and interesting approach is sparse PCA (2), in which one tries to find a loading vector with many zeros that still explains a large part of the variance; this makes interpretation much easier. However, it is clear that no general projection method will reveal the essential structure of information in all cases.
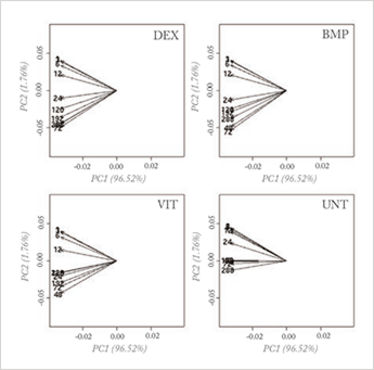
Fig 1a: Loading plot of a PCA analysis on a genomics (osteogenesic time series) dataset, investigating a time effect under different treatments of stem cells; the four planes represent four different treatments and the arrows represent the time points. No differences can be seen in the four treatments when analyzing the whole dataset.
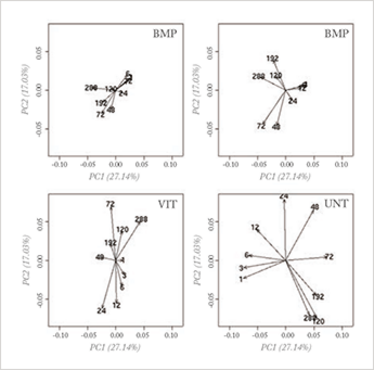
Fig 1b: Loading plot of a PCA analysis of an interesting interaction effect obtained by an ANOVA analysis of the Fig 1a dataset. In this analysis, clear differences between the treatments can be seen; for more explanation, see reference 6.
A much more sensible approach would be to focus first on removing the uninteresting variation. This requires knowledge of at least some of the sources that causes the irrelevant variation, which brings up a key point that has been recognized for some time in chemometrics: incorporating prior knowledge is a key issue in exploring huge datasets. The principle is, however, easier to advocate for than to apply. Yes, application of constraints in analysis is a well-known approach; in curve resolution techniques, for constraints of non-negative concentrations, for the shape of chromatographic/kinetic profiles and for many other factors, it is well established (3). But for explorative analysis hardly anything has been achieved so far.
While explorative analysis implies that not much is known about the data, additional knowledge is often available in the form of gender, disease state, batches, instrument or measurement conditions, and so on. Recently, a promising approach has emerged that exploits this kind of knowledge in explorative analysis: the combination of PCA with analysis of variance (ANOVA). ANOVA is a basic statistical technique that separates variation in data that is caused by different sources (called ‘main effects’ in the ANOVA jargon) and their possible influence on each other (‘interaction effects’ in ANOVA jargon). The basic idea is simple: first, separate the variation in the data according to the different known sources, with ANOVA, and then analyze the interesting parts,
using PCA.
ANOVA models the total variation in the dataset:
Total Variation = Mean +
Variation due to the different main effects (sources) +
Variation due to the different interaction effects +
Residual Variation (not due to any of the known sources)
This approach allows separate analysis of interesting parts of the variation; alternatively, non-interesting variation can be removed before PCA analysis (see Figure 1b). It is especially attractive because it combines cornerstone methods from chemometrics and statistics. Several variants have been proposed which differ mainly in the specific aim of the analysis (4-6).
When more structured information is available this too can be used. For example, the critical information for biomarker discovery is a change from a basic state, in which there is normal but wide variation, to a state in which specific variation is added or removed due to a change, such as in metabolic activity. The detection of changes is open to many discriminant methods although the large amount of ‘normal’ variation can hamper discovery of the sought-for differences. One recent method, orthogonal partial least squares (O-PLS) (7) aims to solve this problem by removing the uninteresting data on the basis that that it is not correlated with, and is thus orthogonal to, class membership. This approach is meeting with some success.
Another new and promising idea models the basic state variation by means of PCA and subsequently projects the other interesting data into this model (8, 9). Part of the variation will be explained by the basic state PCA, but it is the residual, non- explained part that contains the information on the differences from the basic state. This is a powerful approach for detecting minor differences in explorative situations. It is actually the application of a principle that has been used for a long time in the field of industrial process control. Here, the basic, normal state of a multivariate industrial process is modeled into the so-called normal operating conditions (NOC) with PCA. During operation, the process is monitored by projecting the actual state vector into the NOC-space. When this state vector fits nicely into the NOC, everything is okay; when the fit decreases and the residuals increase, the process is ‘out of control’ and the residual variation provides clues to the possible process faults. In the same way, the normal operating conditions (NOC) of the comprehensive -omic profile of healthy (basic state) people, cells or any similar thing can be modeled by PCA. Analysis of the residuals contains clues to the differences in the diseased state. This approach has been successfully applied to detect and diagnose rare metabolic diseases in children (8). The idea of analyzing residuals from well-described states in a focused way is quite new to our field and there is ample room to further elaborate upon it or to generalize it for more complex situations (9).
The above approaches work best when the data are obtained in a well-designed way. While interesting results can be obtained in ‘dirtier’ situations, it requires further research. Current approaches are far from perfect but they do illustrate that one of the keys to breakthroughs in explorative analysis is exploitation of prior knowledge. Much research is still required and novel methods will be welcomed for data that are not well designed.
Nonlinear behavior
Linear models are attractive because their behavior is well studied and understood, and because confidence intervals can easily be constructed to validate their performance in different situations. They also require relatively few data to construct them robustly. Even when the data do not follow linear behavior perfectly, the use of linear models is often preferred for these reasons. In practice, the domain of interest is often split up into smaller parts, where a linear approximation is valid, allowing the use of safe and well understood linear models. Linear regression and PLS are therefore used in the majority of chemometric research studies.
However, linear models are simply not sufficient for the analysis of large datasets. This has been recognized for some time and a good deal of research has been devoted to developing better systems (10). At one point, neural methods were considered to be the nonlinear method of the future but the realization that they behave unstably has made them considerably less attractive. Among the most powerful methods today are the so-called kernel methods, such as support vector machines (SVM) and Kernel PLS. In these methods the data are transformed in a ‘feature’ space, usually of higher dimension, in which linear separation is possible (11). The distance methods, successfully applied in social studies and only recently brought to the attention of chemometricians (12), can be considered as kernel methods too. In these analyses, it is not the data themselves but a distance matrix calculated from the data that is analyzed, using a linear method such as PLS. Walczak showed that with a simple Euclidian distance, noteworthy nonlinear separation problems can be solved.
The major drawback of kernel methods is that they are ‘black box’ models in which information on the important variables is lost. This makes them useless for projects such as biomarker discovery. While samples can be projected into the model and classified, and properties accurately calculated, exactly which variables contribute to the classification or the value of the property under investigation remains unknown. Until this problem is resolved these otherwise powerful kernel methods will not have the utility that they deserve in chemometrics. Recently, an earlier idea from Gower (13) has been exploited to disclose variable information from the kernel model (14, 15). This is the concept of the pseudo-samples or ‘spy samples’, which are artificial samples that carry all their weight in one variable, with the other variables being set to average. When these pseudo-samples are projected in the kernel method they reveal the behavior of the variable for which they carry weight. This can be visualized in a very intuitive way and, while the approach is still its infancy, it has already been applied in complex metabolomics studies (see Figure 2) (16).
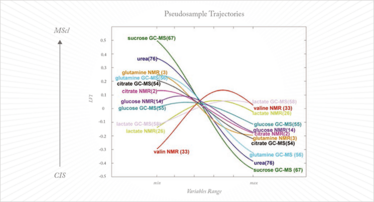
Fig 2: Pseudosample trajectories in a metabolomics study to distinguish clinically isolated syndrome of demyelination (CIS) from multiple sclerosis (MScl). Each pseudosample trajectory reveals the behavior of one metabolite in the two diseases; for more explanation, see Reference 15.
Fusion of data
To acquire a comprehensive molecular picture of a complex system such as the metabolome, a combination or hyphenation of multiple analytical techniques is needed; no single measurement principle can capture all of the molecular diversity and concentration range of the components. There is therefore an urgent need for data analysis approaches that integrate data across platforms and modalities (such as images and profiling methods) and that can even incorporate text data. Several strategies have been proposed for this, which can be divided into low-, mid-, and high-level fusion.
In low-level fusion the different datasets are simply concatenated. For high-level fusion, a separate model is constructed per dataset and it is the outputs of these models that are combined. In mid-level fusion the most interesting features, extracted from each dataset separately, are combined to build the final model. A further approach to data fusion, focused on regression problems, is the so-called multi-block method.
The success of data fusion can be quite variable: sometimes it outperforms the individual datasets while on other occasions the results can be disappointing. This unpredictability in outcome is down to two major factors. First, fusion strategies are almost always linear and, as noted above, linearity cannot be assumed a priori. Some efforts have been made to combine data nonlinearly, by combining kernels of the data rather than the full datasets themselves. This is a powerful method for prediction but the ‘black box’ aspect is a drawback. The concept of pseudo-samples too is also quite promising, as demonstrated in a recent complex study of multiple sclerosis (16). Second, it is apparently impossible to predict or foresee which combination of datasets will be successful. The obvious criteria – correlation with the property under investigation and the amount of mutually exclusive information in both datasets – are not always adequate; in some cases, a dataset uncorrelated with the property under investigation and highly correlated with the first dataset can unexpectedly and drastically improve performance. This imparts to the whole procedure a sense of trial-and-error, and makes it cumbersome and time consuming. Methods to overcome these issues are urgently required.
Chemometric Theory
Unlike (applied) statistics, chemometrics has no underlying theory: it evolved as a fully empirical science in which each dataset is almost considered to be a separate project. There is a recognizable workflow for chemometrics, which is illustrated in Figure 3. Within each box, however, preprocessing or methods of analysis are selected largely based on previous experience and their performance for the problem at hand. Ideally, the problem at hand should be related to a more general situation and from there the strategy or workflow should be streamlined.
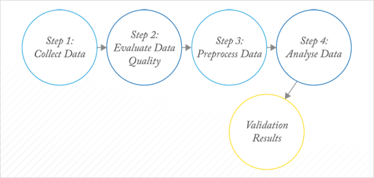
Fig 3: Chemometric workflow.
Sometimes, methods such as preprocessing are specially designed for a specific situation. This does not imply, however, that they will automatically work optimally in similar situations because artifacts, such as base lines, are often instrument- or even environment-dependent, turning each dataset into a unique problem. This leaves no other choice than an empirical trial and error approach for each dataset. But the consequence of the myriad methods developed, each solving a specific problem, is that inexperienced users are totally confused. Taking the example of preprocessing, this chaos is described in work by Engel et al. (17): for what is a straightforward classification problem based on a simple spectroscopic dataset, there are several thousand reasonable preprocessing methods available, all of them published for a similar dataset and problem setting. When these methods are applied by inexperienced but scientifically-sound users, the results are truly astonishing, as shown in Figure 4. Each dot represents a specific ‘reasonable’ preprocessing according to two performance criteria: the classification performance and the model complexity. What might be described as ‘reasonable’ or ‘previously successful’ is no guarantee of success with the problem at hand. This chaos is, I venture, the main reason that chemometrics does not get the consideration that it deserves from analytical scientists.
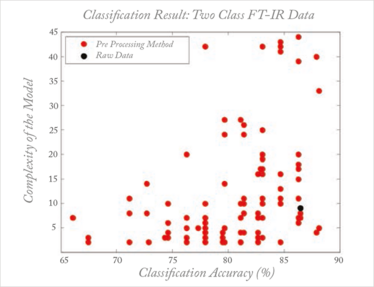
Fig 4: Effect of different preprocessing methods on performance (classification accuracy and model complexity) in a simple discrimination problem. Each dot represent a reasonable preprocessing method; the black dot represents analysis on the raw data (without preprocessing) For more explanation, see Reference 16.
The complexity of the situation does not, however, exempt us from trying to find structure in this apparent chaos. If we, as chemometricians do not succeed in at least partially solving this problem, we cannot expect to survive the data tsunami. The good news is that there is already one part of the data workflow in which progress has been made, namely validation. We can rightfully be proud of our achievements and attitude towards the thorough and independent validation of results. We must stay focused on this, especially on the validation of explorative methods.
The main reason that chemometrics has ended up in a tricky situation is that chemometricians have dared to tackle the difficult ‘dirty’ problems that don’t fit nice statistical distributions or theories. Chemometrics emerged where statistical theory was no longer applicable, a fact that has been recognized by statisticians (18).
This is not a unique situation; I would make the comparison with medicine (as with all comparisons it hobbles, but it is thought-provoking). Underlying biochemical and physiological theories provide the basis of medical sciences. A clinician, however, has to treat individual patients whose symptoms are unique. These symptoms are probably related to an underlying biochemical or physiological problem but are co-influenced by a myriad of internal and external factors, making the exact appearance of illness specific for every patient. Despite this complexity, medical diagnosis and treatment have emerged as medical sciences.
A similar kind of chemometric theory will allow a much more structured and logical approach to the analysis of complex data. Better diagnosis and understanding of the underlying issues will enable the selection of a more efficient treatment. Moreover, better understanding of data and their peculiarities will help in one other aspect that is of increasing importance, namely the prevention of scientific fraud. The analysis of data is especially prone to fraud. I am convinced that with a chemometric theory and with our attitude to validation, we can contribute to the development of a general strategy for fraud prevention.
The development of a chemometric theory will be an important, if not the most important, step towards tsunami-worthy chemometrics.
- M. Daszykowski, "From projection pursuit to other unsupervised chemometric techniques," J. Chemometr., 21, 270-279 (2007).
- M. A. Rasmussen and R. Bro, "A tutorial on the Lasso approach to sparse modeling," Chemometr. Intell. Lab., 119, 21-31 (2012).
- L. Blanchet et al., "Focus on the potential of hybrid hard- and soft-MCR-ALS in time resolved spectroscopy," J. Chemometr., 22, 666-673 (2008).
- A. K. Smilde et al., "ANOVA-simultaneous component analysis (ASCA): a new tool for analyzing designed metabolomics data," Bioinformatics, 21, 3043-3048 (2005).
- P. D. Harrington et al., "Analysis of variance-principal component analysis: A soft tool for proteomic discovery," Anal. Chim. Acta, 544, 118-127 (2005).
- J. de Haan et al., "Interpretation of ANOVA models for microarray data using PCA," Bioinformatics, 23. 184-190, (2007).
- J. Trygg and S. Wold, "Orthogonal projections to latent structures (O-PLS)," J. Chemometr., 16, 119-128 (2002).
- J. Engel et al., "Towards the disease biomarker in an individual patient: a metabolomics study," submitted 2013.
- J. J. Jansen et al., "Projected Orthogonalized CHemical Encounter MONitoring (POCHEMON) for fungal interactions during co-culture," submitted 2013.
- J. D. Malley and J. H. Moore, "The disconnect between classical biostatistics and the biological data mining community," BioData Mining, 6, 12 (2013).
- V. Vapnik, S. Golowich and A. Smola, "Neural Information Processing Systems 9," MIT Press: Denver, USA (1996).
- P. Zerzucha and B. Walczak, "Concept of (dis)similarity in data analysis," Trac-Trends Anal. Chem., 38, 116-128 (2012).
- J. C. Gower and S. A. Harding, "Nonlinear bioplots," Biometrika, 75, 445-455 (1998).
- G. J. Postma, P. W. T. Krooshof and L. Buydens, "Opening the Kernel of Kernel Partial Least Squares and Support Vector Machines," Anal. Chim. Acta, 705, 123-34 (2011).
- P. W. T. Krooshof et al., "Visualization and Recovery of the (Bio)chemical Interesting Variables in Data Analysis with Support Vector Machine Classification," Anal. Chem., 82, 7000-7007 (2010).
- A. Smolinska et al., "Interpretation and visualization of non-linear data fusion in kernel space: study on metabolomic characterization of progression of Multiple Sclerosis," PloS ONE, 7. DOI: 10.1371/journal.pone.0038163 (2012).
- J. Engel et al., "Breaking with trends in pre-processing?," Trac-Trends Anal. Chem., 50, 96-106 (2013).
- L. Breiman, "Statistical modeling: The two cultures," Statistical Science 16, 199-215 (2001).
“During my PhD on drug activity, I realized that much more information is hidden in experiments than is obvious at first sight,” says Lutgarde Buydens. As a student of Désiré Luc Massart, one of the founders of chemometrics, data analysis and interpretation quickly became her main focus. After postdocing in the US, Buydens joined Radboud University in the Netherlands, where she is now chair in Analytical Chemistry – Chemometrics. Her interest in better data analysis and interpretation is as strong as ever. “To help discover new knowledge in so many different fields, from food science, medical sciences to industrial processes still excites me every day,” she says.

