Overcoming Chemical Prejudice
A Pfizer structure elucidation scientist teams up with Bruker’s software programmers to go 3D.
Don Richards |
The Problem
The number of potential formulae for unknown impurities can be huge. How can this list be intelligently reduced without relying on assumptions based on what we think is known?
Background
In my role at Pfizer, I worked in a team responsible for the structure elucidation of unknown impurities in pharmaceuticals using LC-MS and NMR, which usually presented themselves as small peaks in HPLC. Accurate mass measurements allow formulae to be predicted but the list of possibilities is often long, so there is a need to decide which possibilities to consider first. There is a great temptation to use chemical knowledge, such as the formula of the main component or its synthetic route to reduce this list, which is referred to as using chemical intelligence. A less polite description is chemical prejudice.
A good example springs to mind. The task was to identify a small impurity in an intravenous solution of an antifungal drug. Amongst the list of formulae predicted by accurate mass measurement was a formula containing a large number of oxygen atoms—many more than were in the formula of the drug. The MS/MS spectra of the drug and the impurity indicated that the impurity was drug related. The formula containing many oxygen atoms was abandoned, and I was unable to solve the structure.
Some months later, when others had toiled to isolate sufficient material for NMR, the impurity was found to be a sugar derivative of the drug molecule. The formula containing the large number of oxygen atoms was the correct one.
I decided there must be a more objective way of deciding on which formula from a long list of possibilities is the correct one rather than relying on chemical prejudice. Whether my need for more objective decision making was driven by ever-increasing demands for efficiency and productivity or the avoidance of professional embarrassment, I would not like to say.
The use of MS/MS seemed a good place to start since we were able to acquire data with the same high mass accuracy as for the parent ion. The correct formula for each fragment must be a subset of the correct formula for the parent ion. I tried to apply this logic to eliminate parent ion formulae that were inconsistent with the possibilities for all fragment ions. Even with this level of effort the list remained stubbornly long. For example, a parent ion with 10 possible formulae made up of five fragment ions (each with 10 possible formulae) requires 500 comparisons to be made. It was clear that this strategy was likely to reduce efficiency or productivity if applied routinely.
Greater mass accuracy would of course shorten the list of formulae. I calculated that a mass accuracy of 0.03 milliDaltons (30 microDaltons!) would be required to produce only one formula for reserpine (m/z = 609). This was and still is far beyond the capability of the instruments available. Matching the theoretical isotope pattern of the possible formulae with the observed pattern was another possible approach. This proved to be trivial when chlorine or bromine were present but, for C, H, N, O, F and even S combinations, the fits were very poor
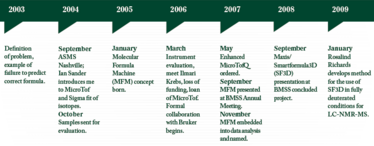
During the 2004 ASMS conference in Nashville, I bumped into Bruker’s Ian Sanders, who wanted to introduce the new MicroTof. Ian proudly told me about its excellent isotopic fidelity. The isotope patterns in the spectra were indistinguishable from the theoretical simulations; using the isotope fit on this instrument for the parent ion would clearly be an advantage in reducing my stubborn lists of formulae. I decided to do a blind test on some typical drug samples to assess the MicroTof and was very impressed with the results.
Certainly, the MS/MS and isotope approaches were both able to reduce the lists of possible formulae, but they were mutually exclusive. Our QStar Pulsar had excellent MS and MS/MS measurement capabilities, but it had poor isotopic fidelity. While the MicroTof had excellent isotopic fidelity but was not capable of MS/MS measurements. Therefore, neither of these parallel approaches was able to deliver what we really needed. But what if they could be combined?
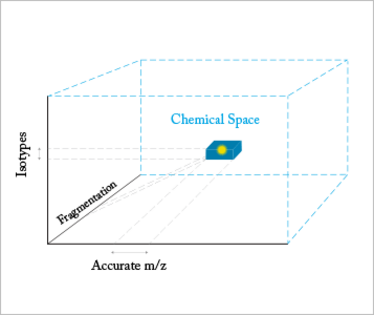
Fig 1: The correct formula resides in a 3D chemical space along with many other incorrect formulae. The space can be investigated by accurate mass measurement, which slices through in one dimension creating a band of possibilities. If we then investigate using isotope measurements, we slice again but through a second dimension. Using fragmentation to slice through the third dimension, we can create a cube containing the correct formula and very few other possibilities.
At the Bruker MicroTof Q evaluation, Ian introduced me to Ilmari Krebs, a software programmer but perhaps more importantly a very able analytical chemist. He immediately understood what I wanted to do and said with typical modesty that he may be able to help. Within a short time he had produced a rudimentary program using excel spreadsheets.
Then disaster struck: our funding for the new instrument was withdrawn because of a more urgent need elsewhere. Fortunately, Ian could see the value in the 3D approach to formula determination and was able to provide a MicroTof to allow the work to continue. This was the beginning of a formal and very fruitful collaboration with Bruker.
The MicroTof did not allow MS/MS measurements and the use of ‘In source CID’ can be misleading—ions of lower m/z than the parent ion originating in the source are more likely to be the result of ion-molecule reactions than CID, so their use in unknown structure elucidation is a very risky business.
The Solution
In the tender process for a new mass spectrometer, we had placed high mass accuracy in MS and MS/MS and high isotopic fidelity at the top of our ‘most wanted’ list. Our need for mass accuracy was easily understood, but what the vendor applications chemists thought of my apparent obsession with measuring isotope ratios, I do not know.
I had previously explained to Ian my idea to combine accurate mass measurements, isotope pattern and fragment information into what I was now calling the Molecular Formula Machine.
To ensure that we only considered ‘In source CID’ ions equivalent to true MS/MS ions, we used our QStar to determine the true MS/MS spectra. This meant repeating everything on the QStar to select ions for the MS/MS dimension. Though it was an onerous task it proved to be a very fortunate one. The program had to be written to allow selection of the MS/MS peaks that must be explained in the correct formula. This would later prove to be invaluable as it allowed us to process the data for low intensity ions with larger m/z measurement errors and whose isotope patterns may be incomplete or distorted as a result of low s/n, but to use only the most intense peaks to eliminate incorrect formulae. Had the MicroTof–Q been available to us immediately, we may not have implemented this feature to prevent smaller, less well-measured peaks to influence the result without eliminating them altogether by applying a data threshold. Smaller peaks can be very important in determining the structure of the molecule at a later stage.
Our budget for the new instrument purchase was restored the following year. On a visit to Bruker to discuss the Molecular Formula Machine, Ian showed me an instrument so new that it didn’t even have a name. And it was clear that it would have superior resolution and mass accuracy performance – an “Enhanced MicroTof-Q”. I placed an order and was the first customer to take delivery of the Maxis.
Beyond the Solution
The Molecular Formula Machine became known as Smartformula3D. The combination of the new Maxis and software meant that our lists were often reduced to a single correct formula. Fragment ion formulae were provided as bi-products, which gave us a flying start with structure elucidation. It became so successful and reliable that when one of my NMR colleagues was given a formula to work with she would ask if it was from Smartformula3D and treat the formula with healthy suspicion if it was not. The only downside to this success was that my colleagues would walk past the QStar to form a queue at the Maxis. While I had great affection for the Qstar, I had been promoted to Head of Structure Elucidation and could not justify keeping it for my own infrequent visits to the lab. It was donated to the University of Sheffield—another cloud with a silver lining, I hope.
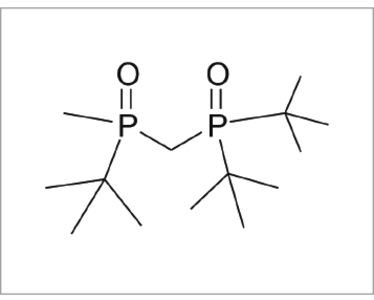
Fig 2: Impurity
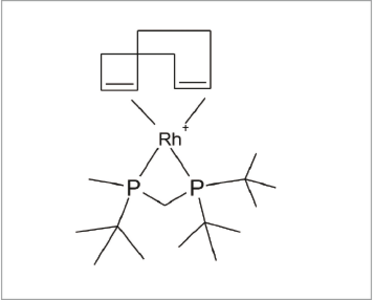
Fig 3: Catalyst
My colleague Richard Joyce provided a beautiful illustration of our success when he was asked to determine the structure of a small HPLC peak arising from the synthesis of a relatively small molecule using a rhodium catalyst. Accurate mass measurement suggested only one possible formula: C11H27N4O5+, but Smartformula3D gave no result. Had it failed? The mass error on the one proposed formula was larger than we would expect from the Maxis, so I suggested that he try allowing for the presence of sulphur and fluorine. Smartformula3D was again unable to produce a result. He then tried phosphorus and Smartformula3D produced a single formula: C14H33O2P2+, with a very small accurate mass error. Very quickly, Richard was able to elucidate the structure of the impurity (see Figure 2).
Where did the phosphorus come from? When reporting the structure to the chemist, the reply came: “Oh, that will be the catalyst!” (see figure 3).
I think I can claim success with this solution. There has certainly been an increase in efficiency and productivity, as well as considerably less potential for professional embarrassment…
Today, the flagship of the Structure Elucidation Team at Pfizer is an LC-NMR-MS system incorporating a 600MHz Cryo-cooled NMR and a MicroTof-Q2. Rosalind Richards has perfected the use of Smartformula3D in fully deuterated conditions. And the structural information yield is truly phenomenal. But that’s another story.
Don Richards is Director of Integrated Characterisation Solutions at Bruker.
Don Richards received a PhD in Chemistry from the University of Keele in 1985 before holding several management positions in the mass spectrometry market. A 17-year career at Pfizer helped Don become an expert in the structure elucidation of a diverse range of small organic molecules: process intermediates, process impurities, degradants, metabolites, natural products. Don now holds a global role at Bruker as Director of Integrated Characterisation Solutions.
